Articles
Switzerland March producer and import prices +0.1% vs +0.3% m/m prior
April 14, 2025 13:41 Forexlive Latest News Market News
Slight delay in the release by the source. Looking at the breakdown, producer prices were seen up 0.1% on the month while import prices were flat in March. From a year-on-year perspective, producer and import prices were seen down 0.1% compared to March 2024.
This article was written by Justin Low at www.forexlive.com.
Easter Holidays Trading Schedule 2025
April 14, 2025 13:39 ICMarkets Market News
Dear Client,
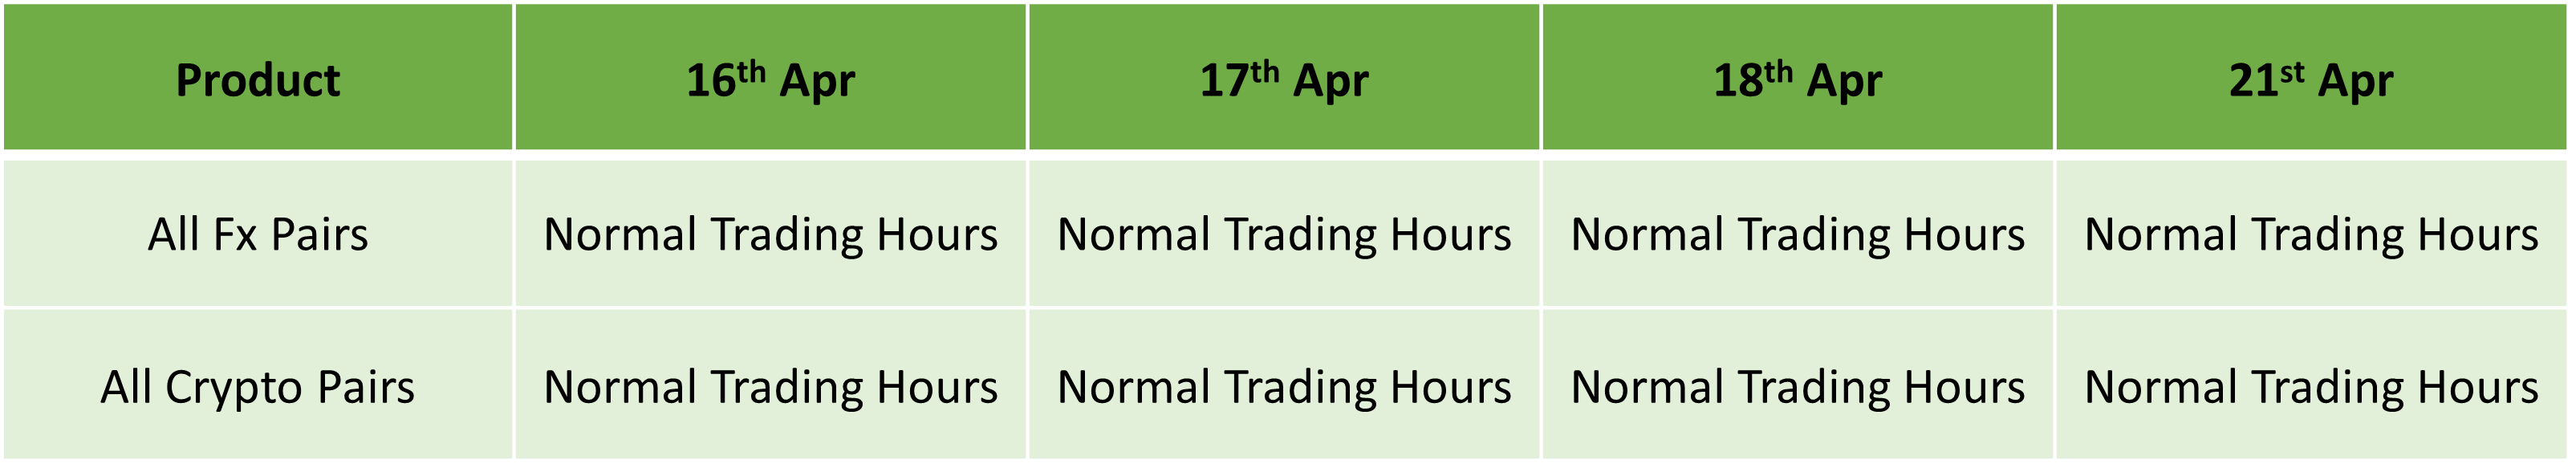
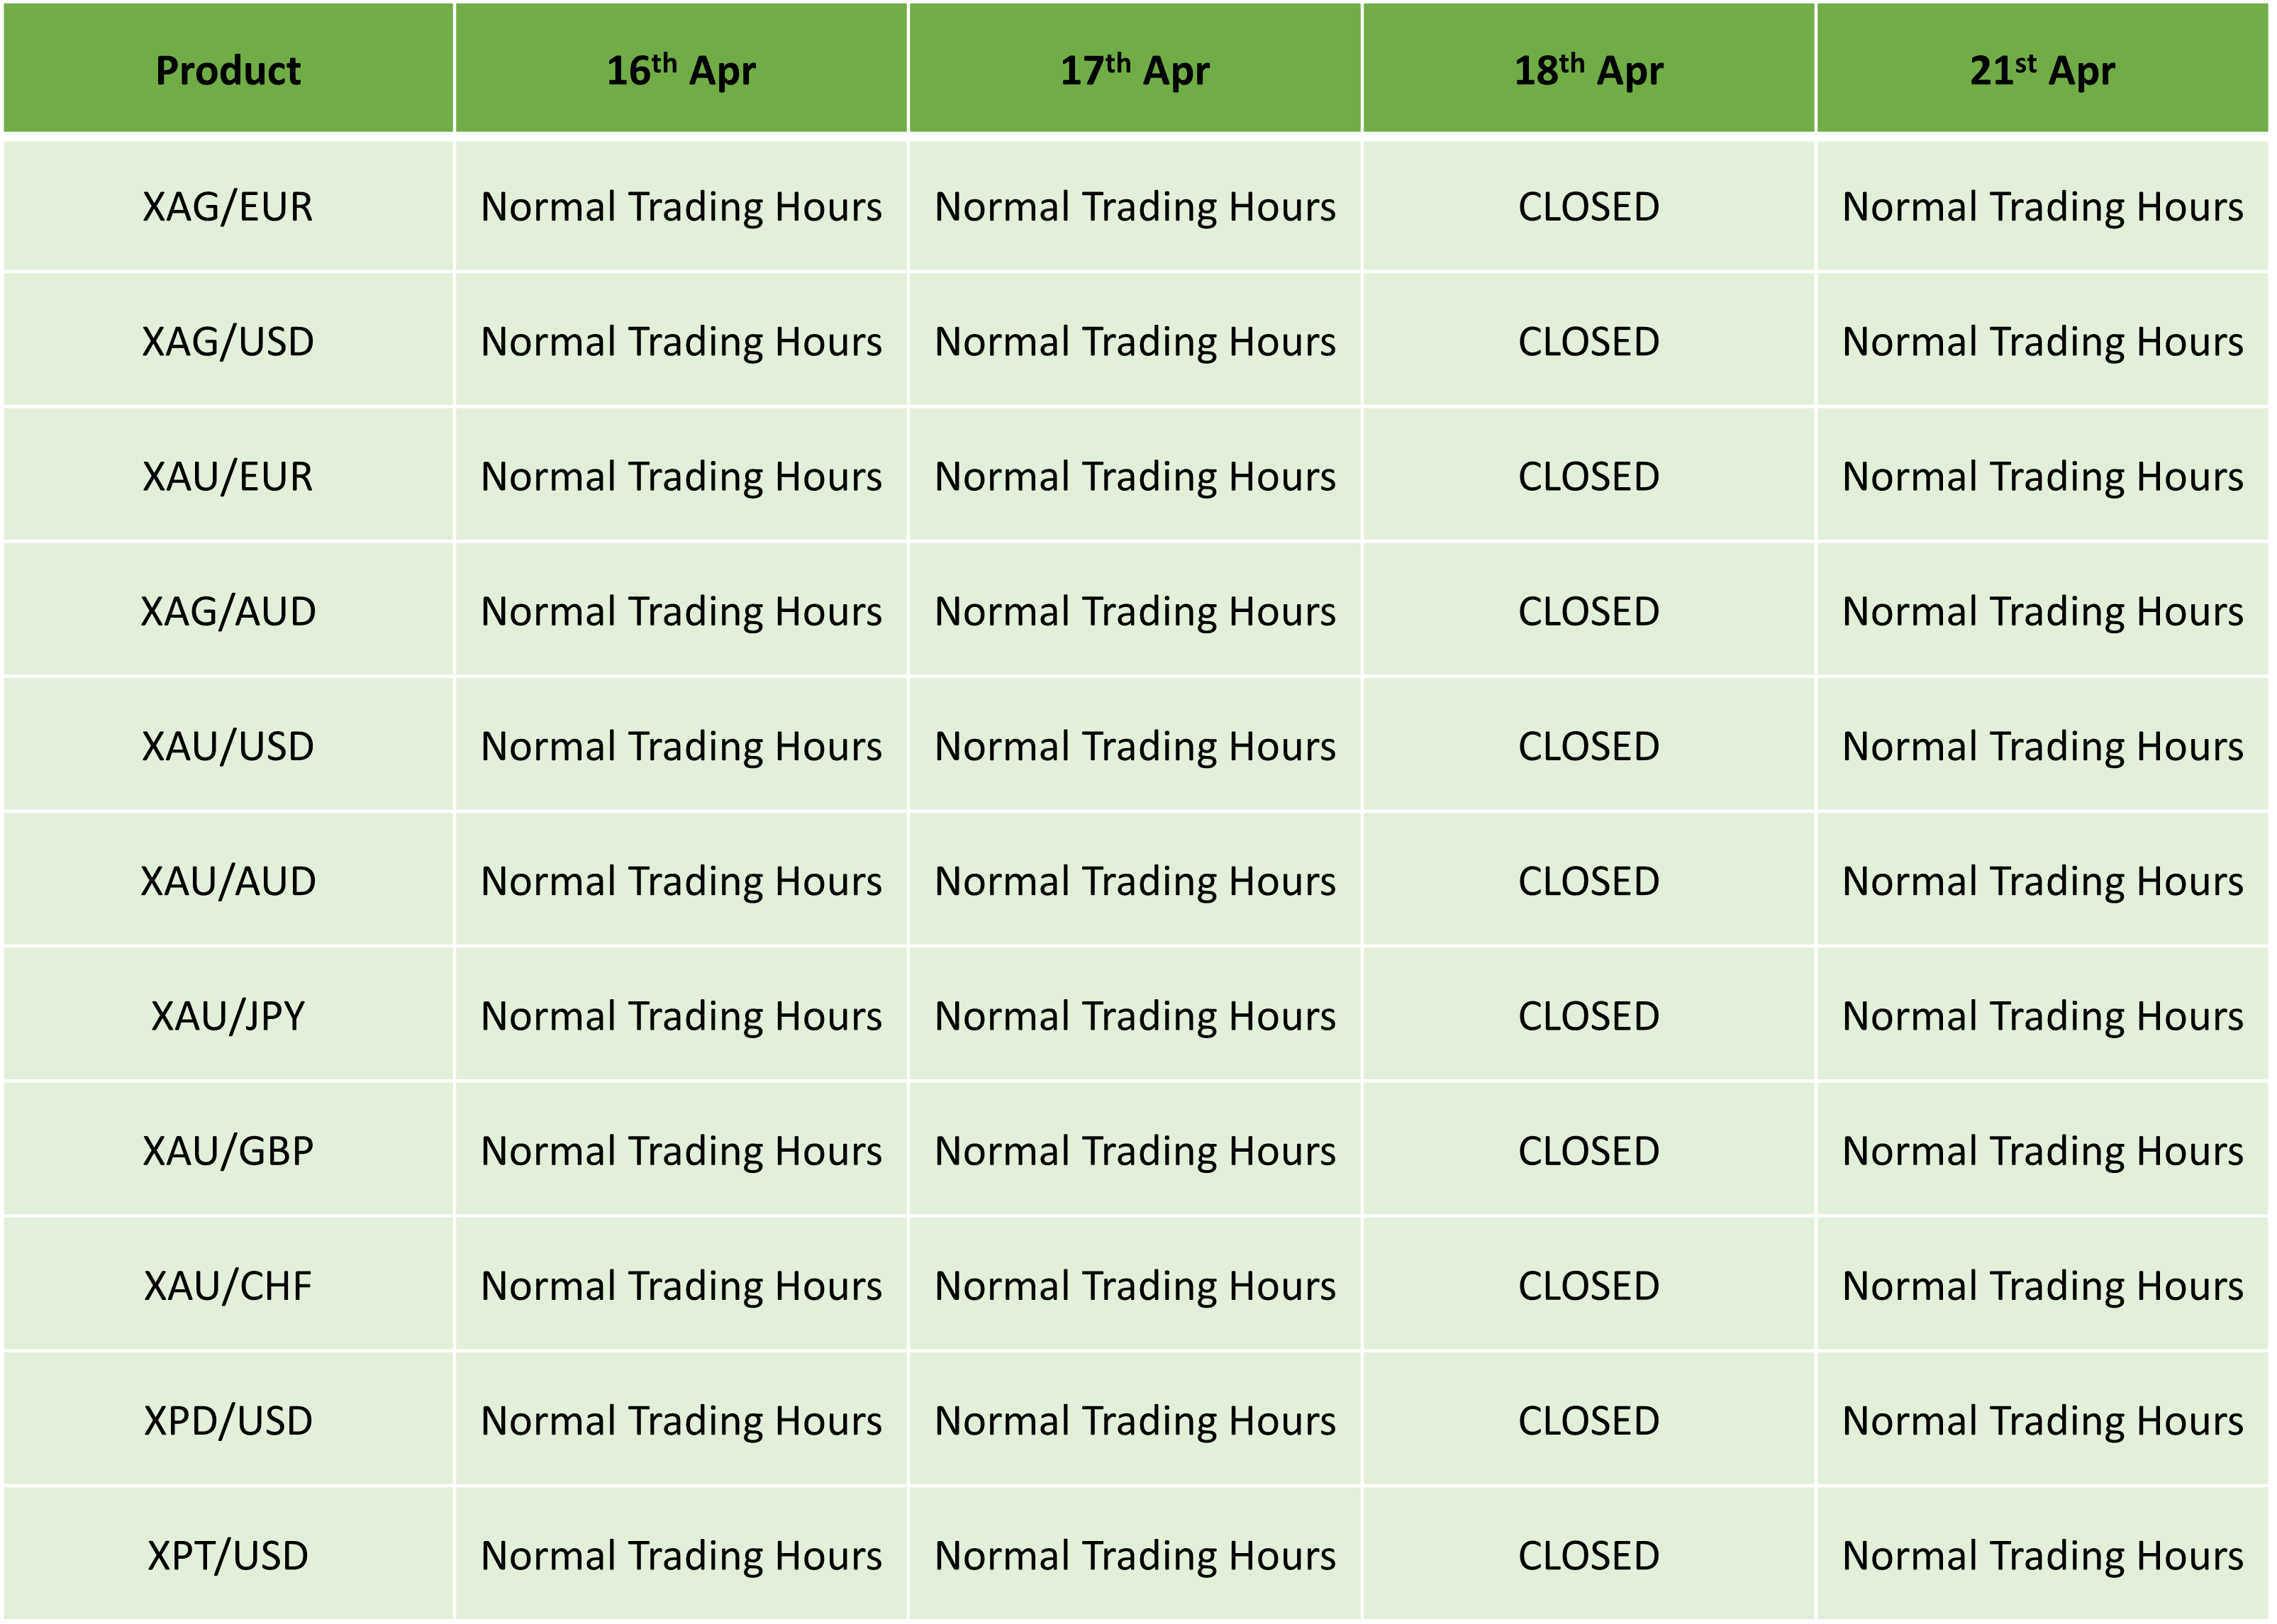
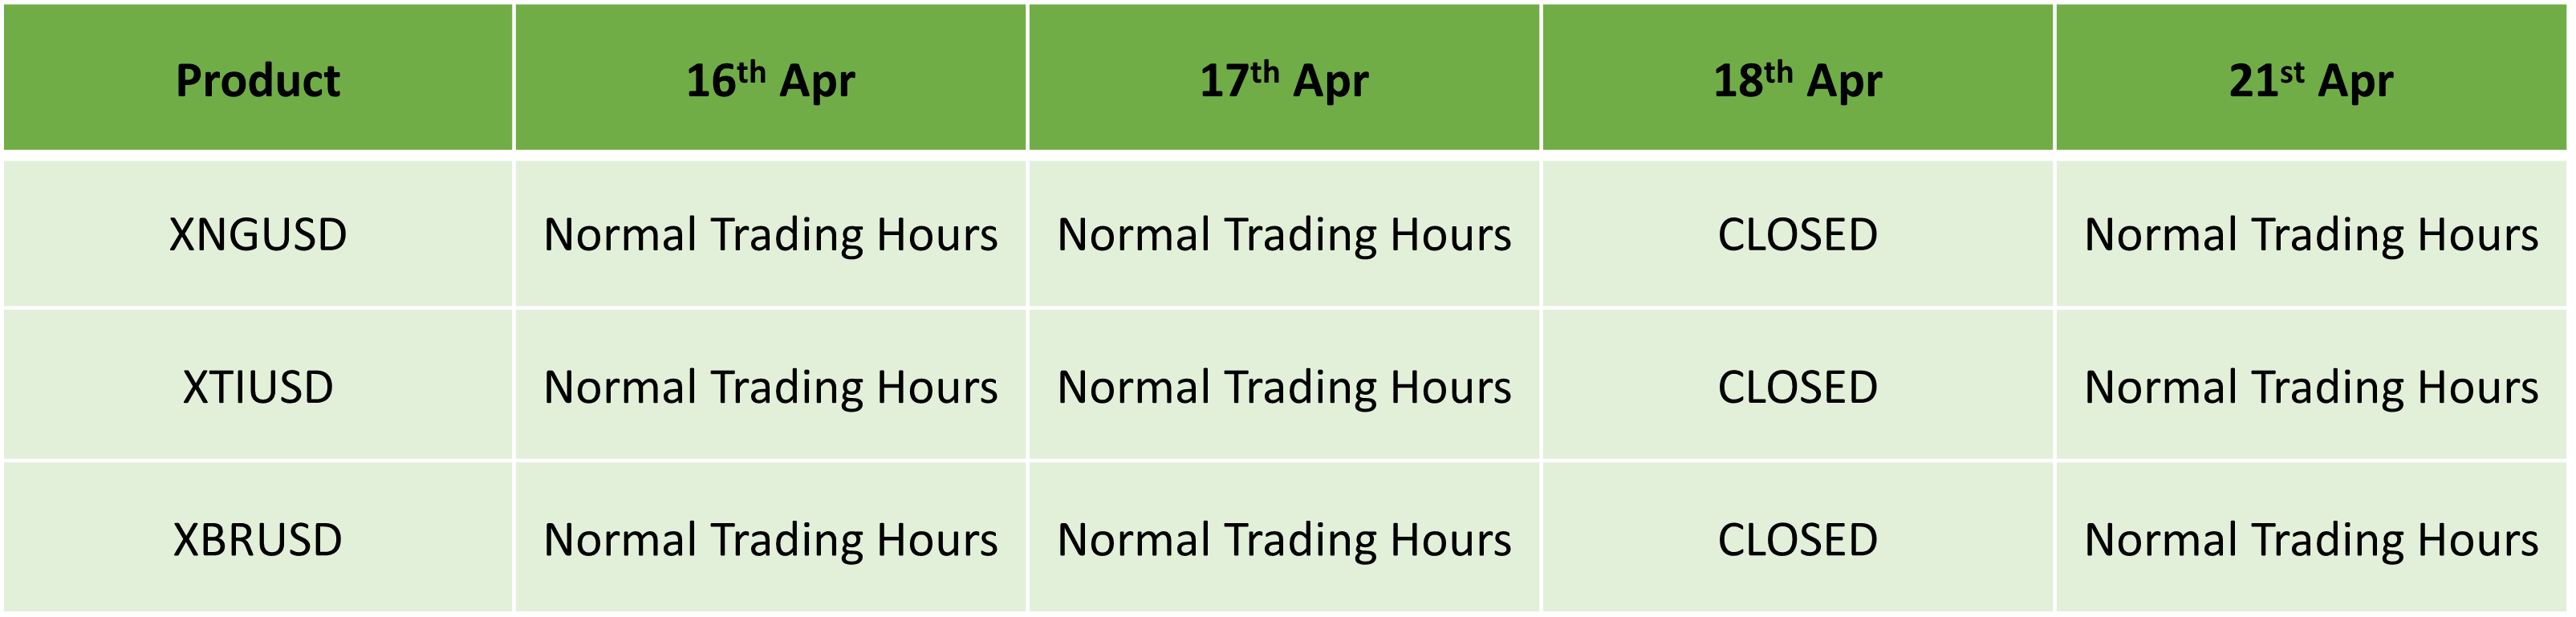
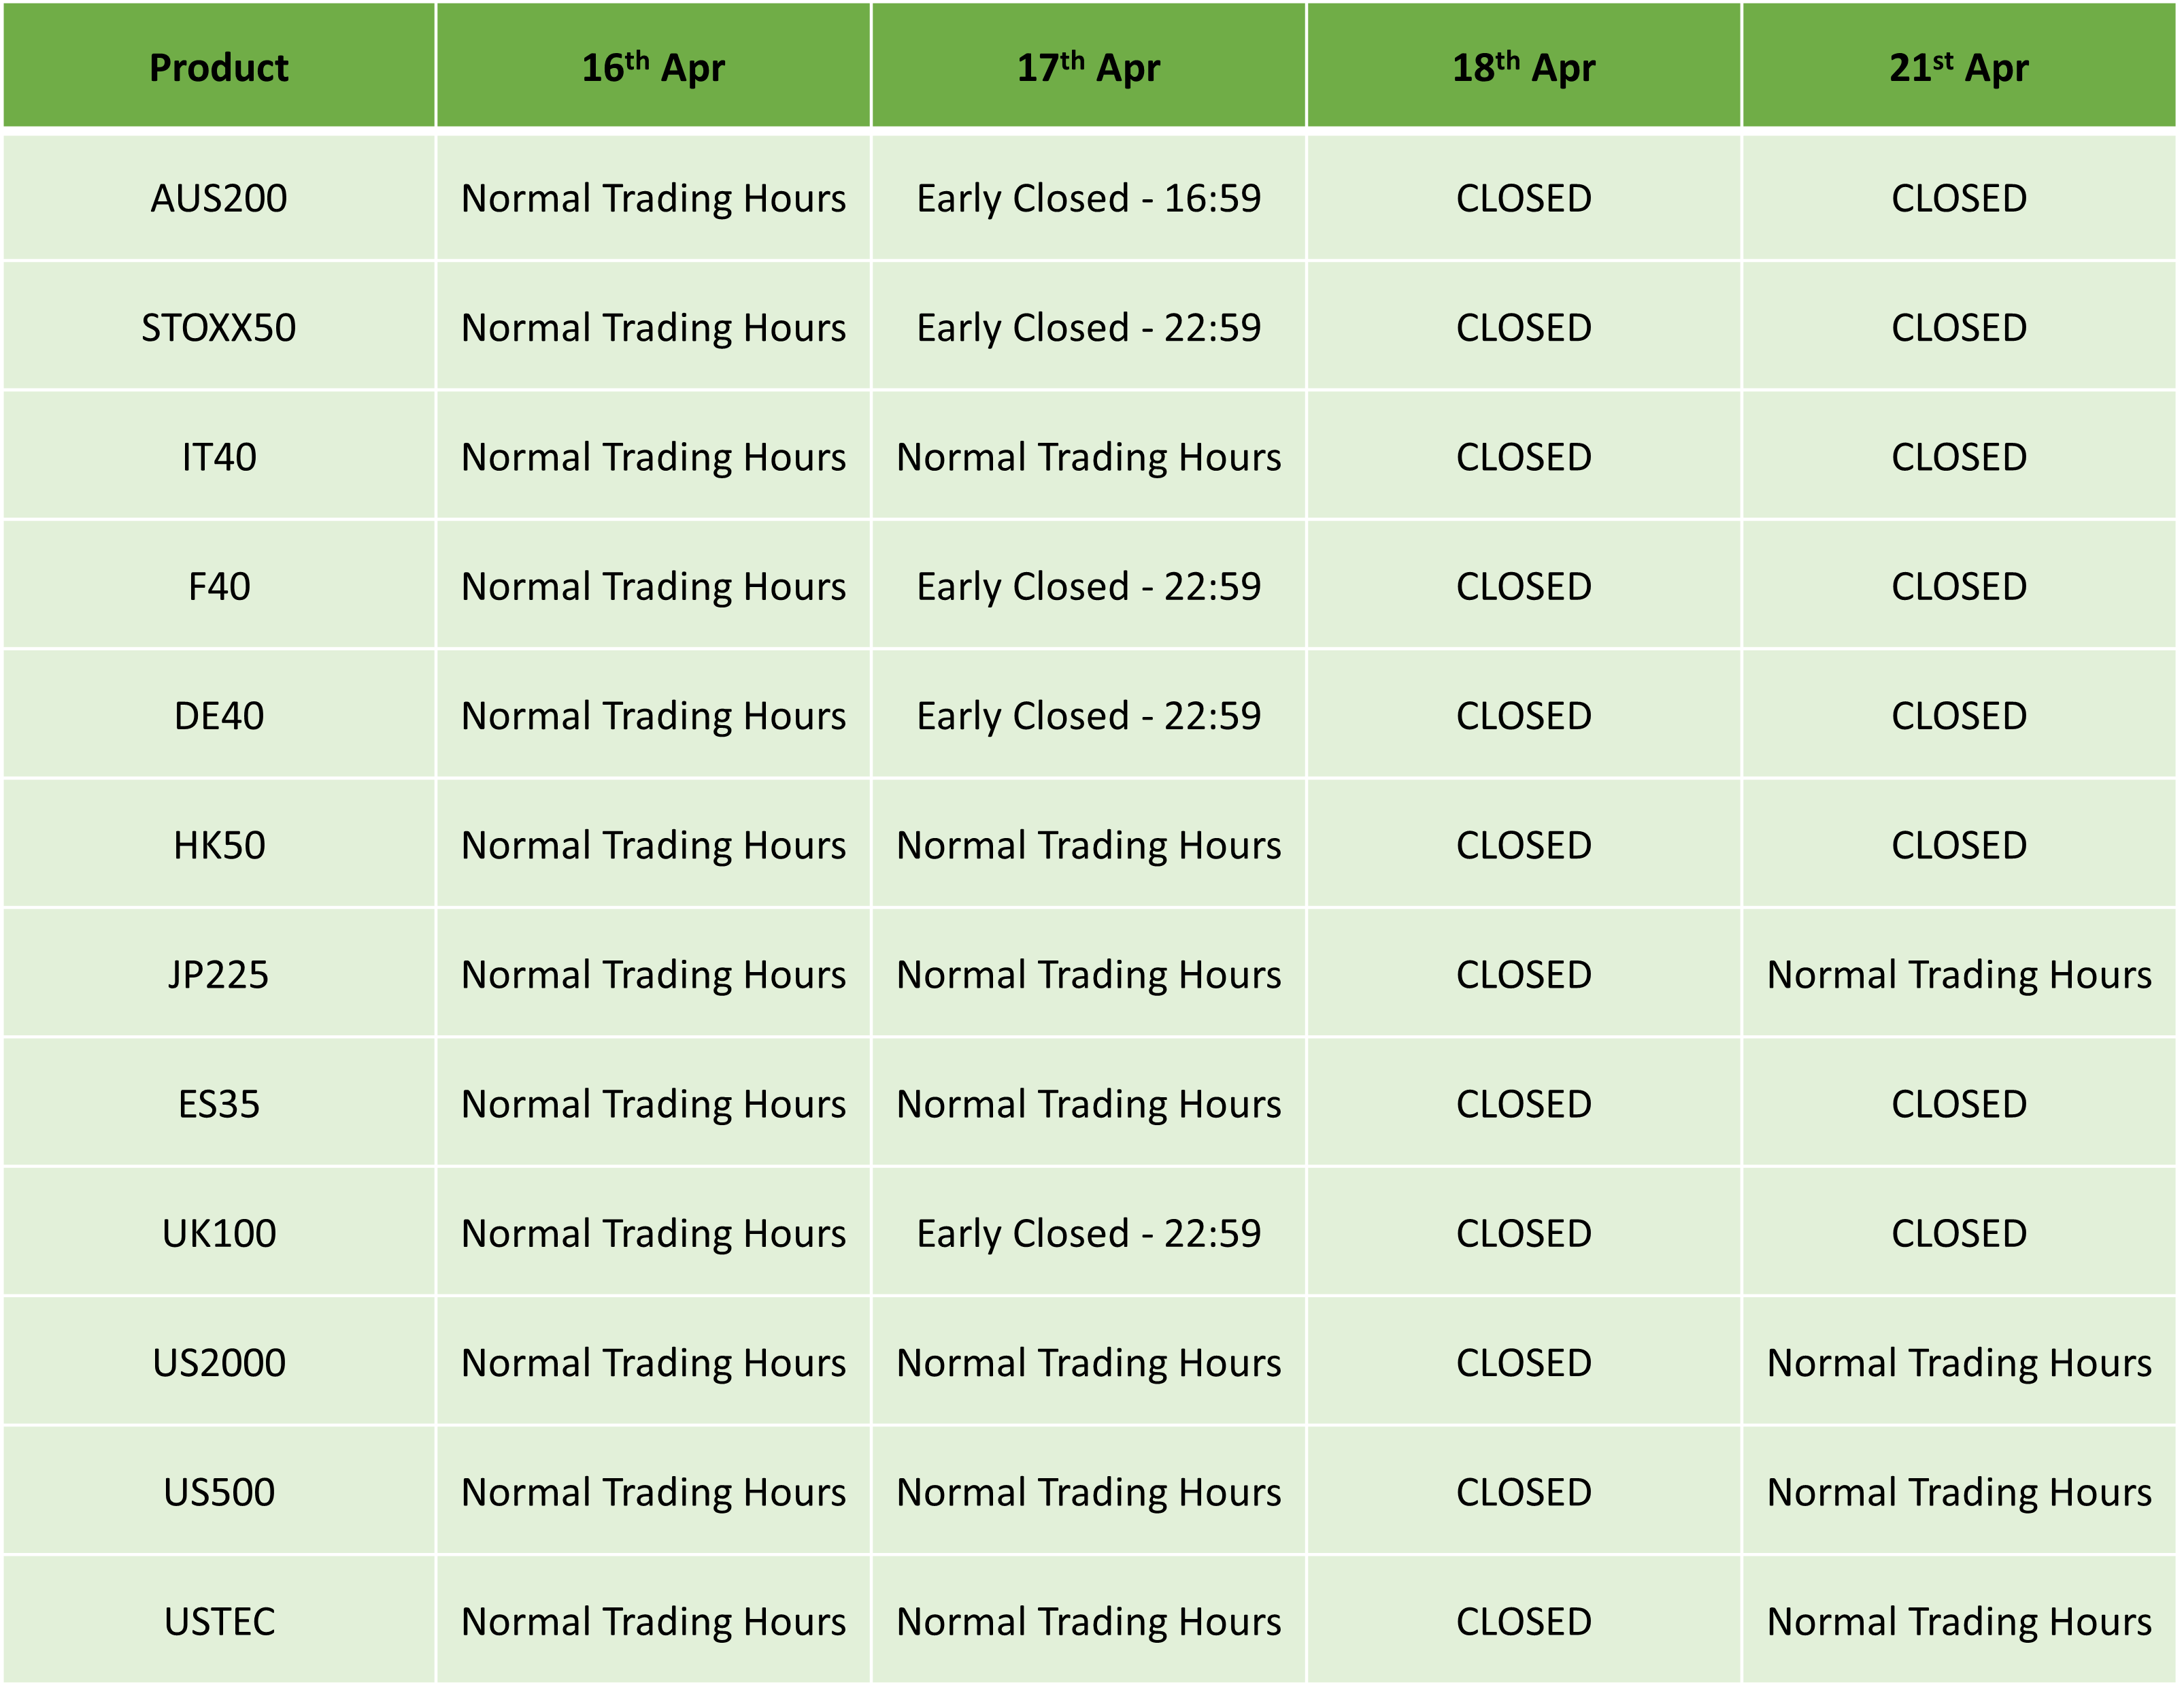
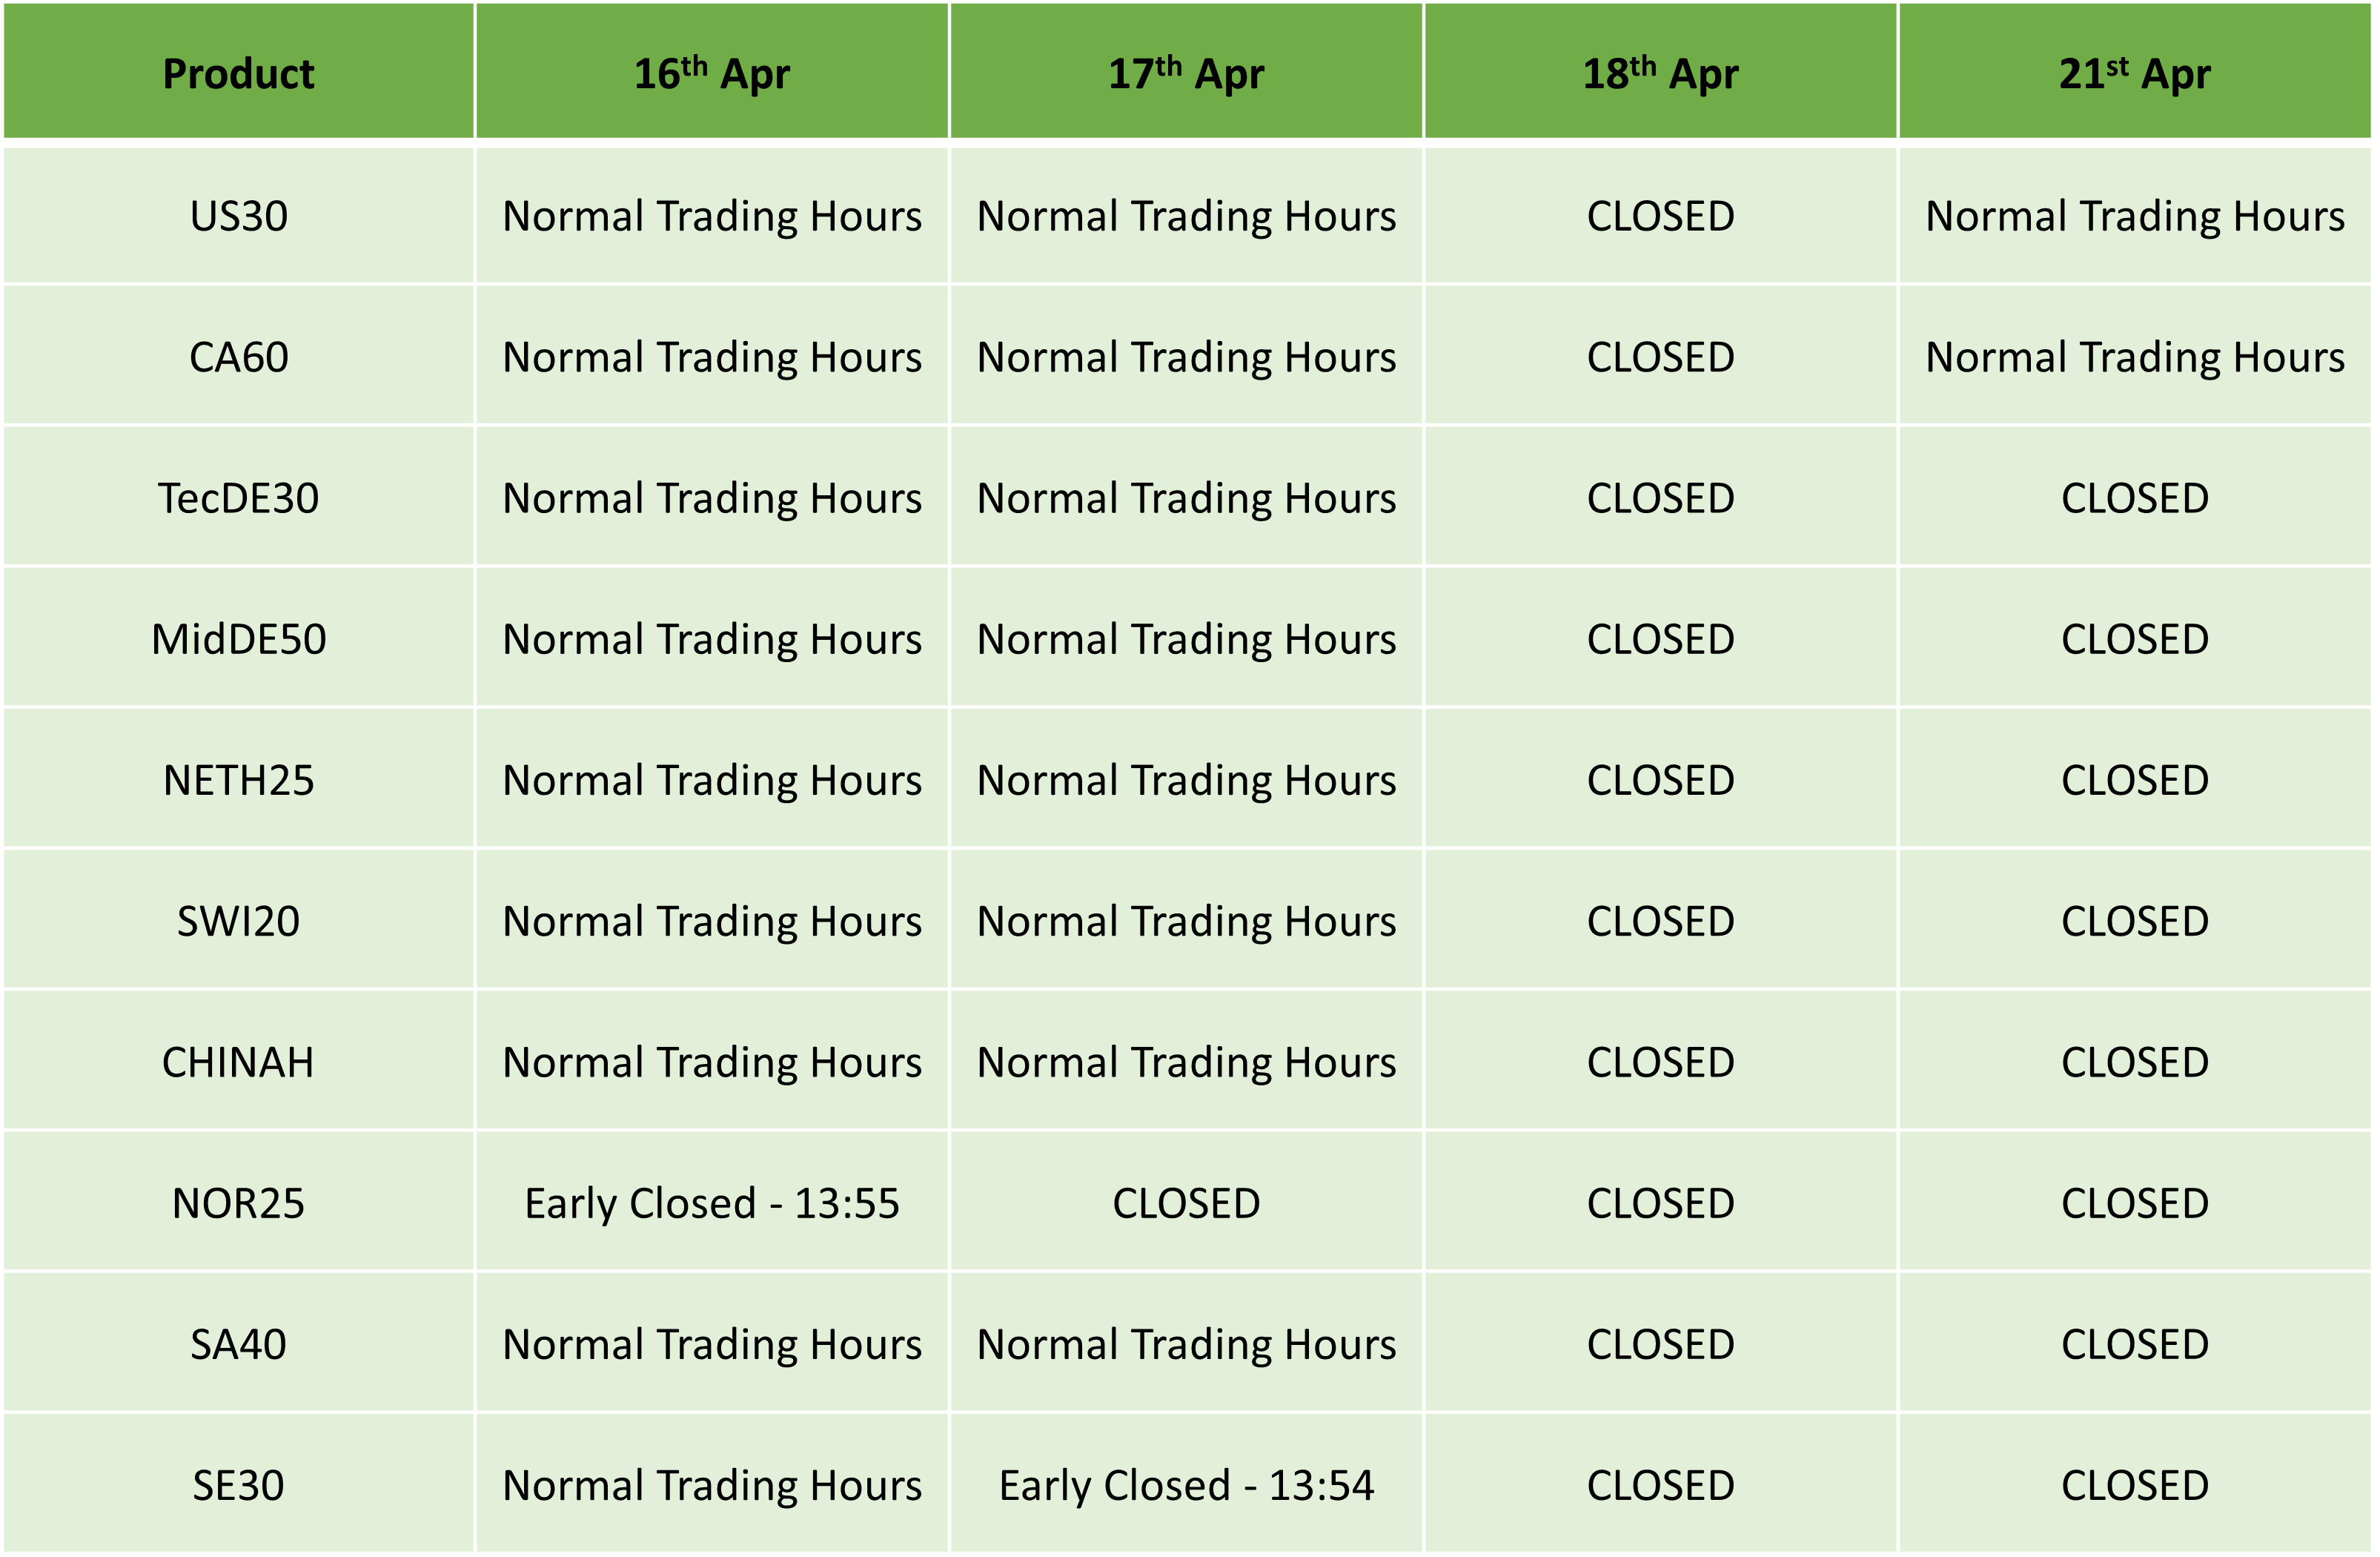
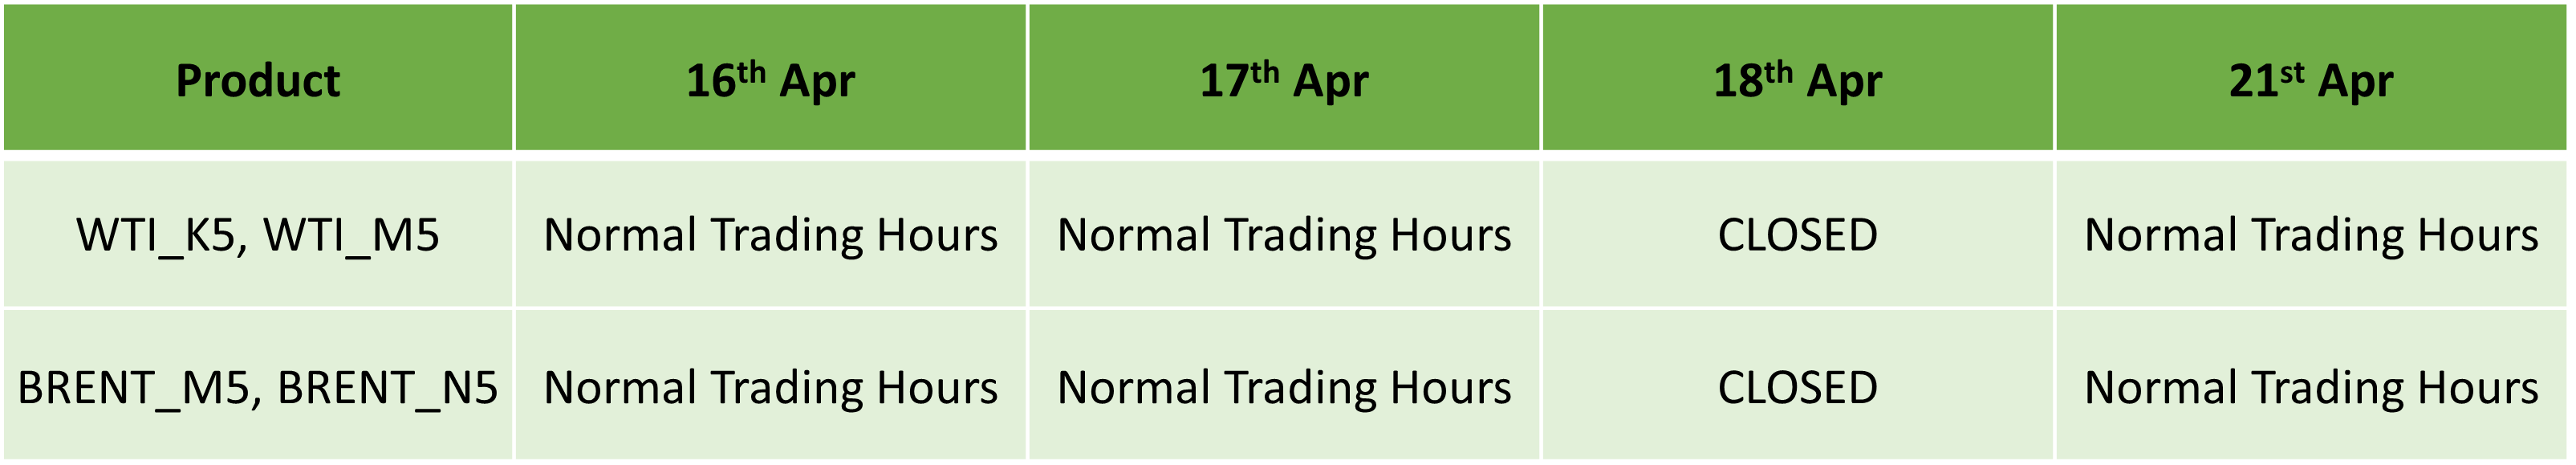
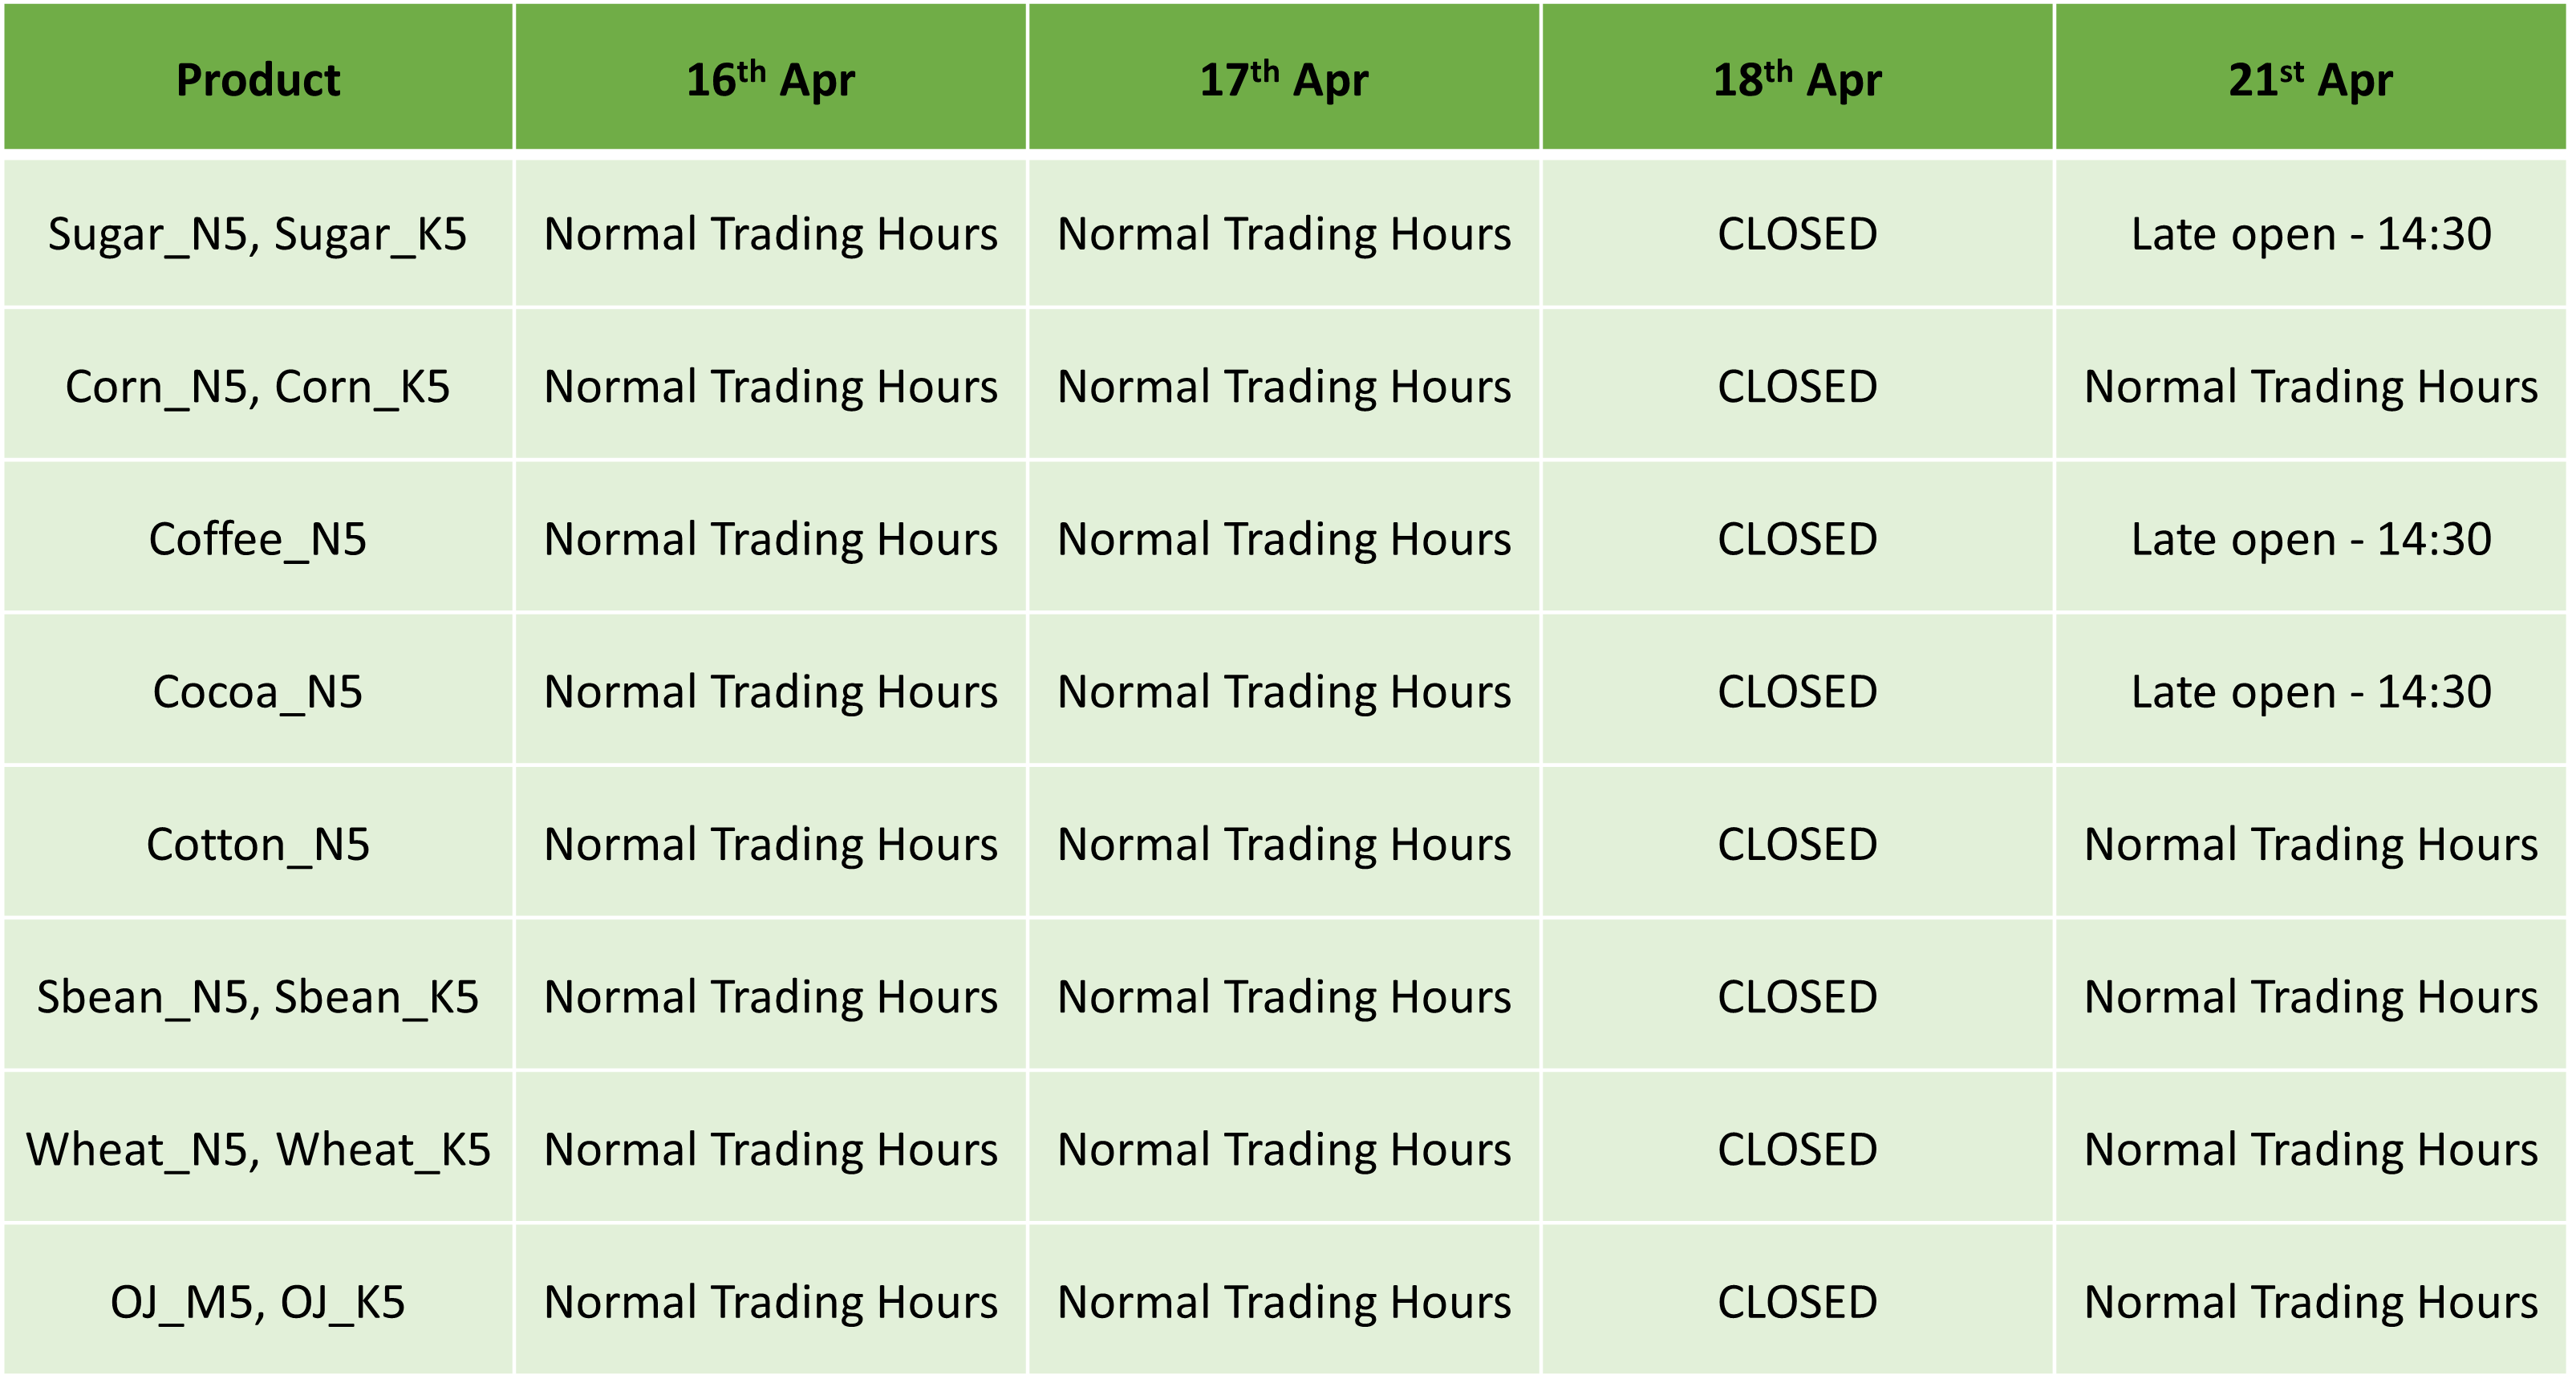
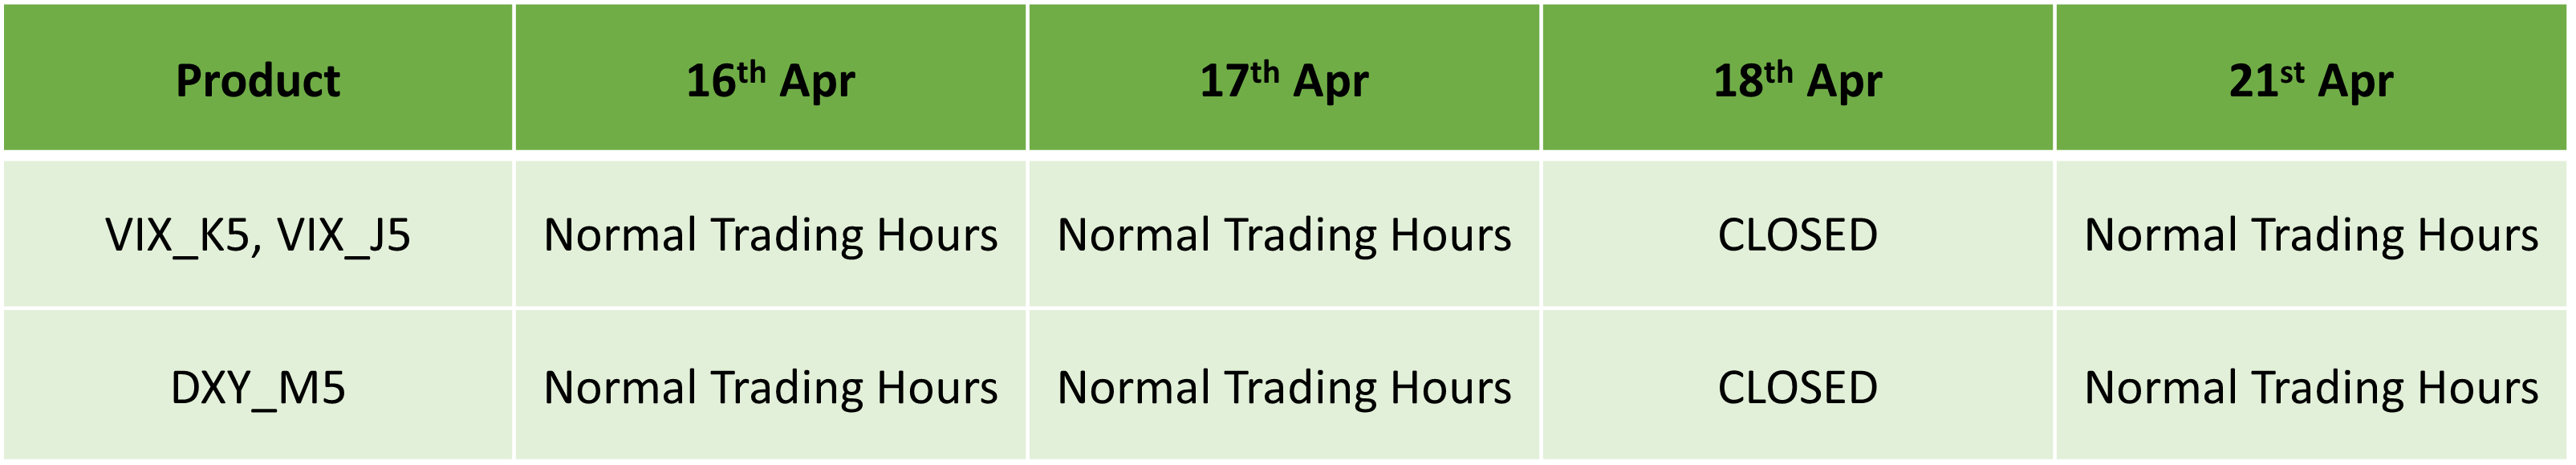
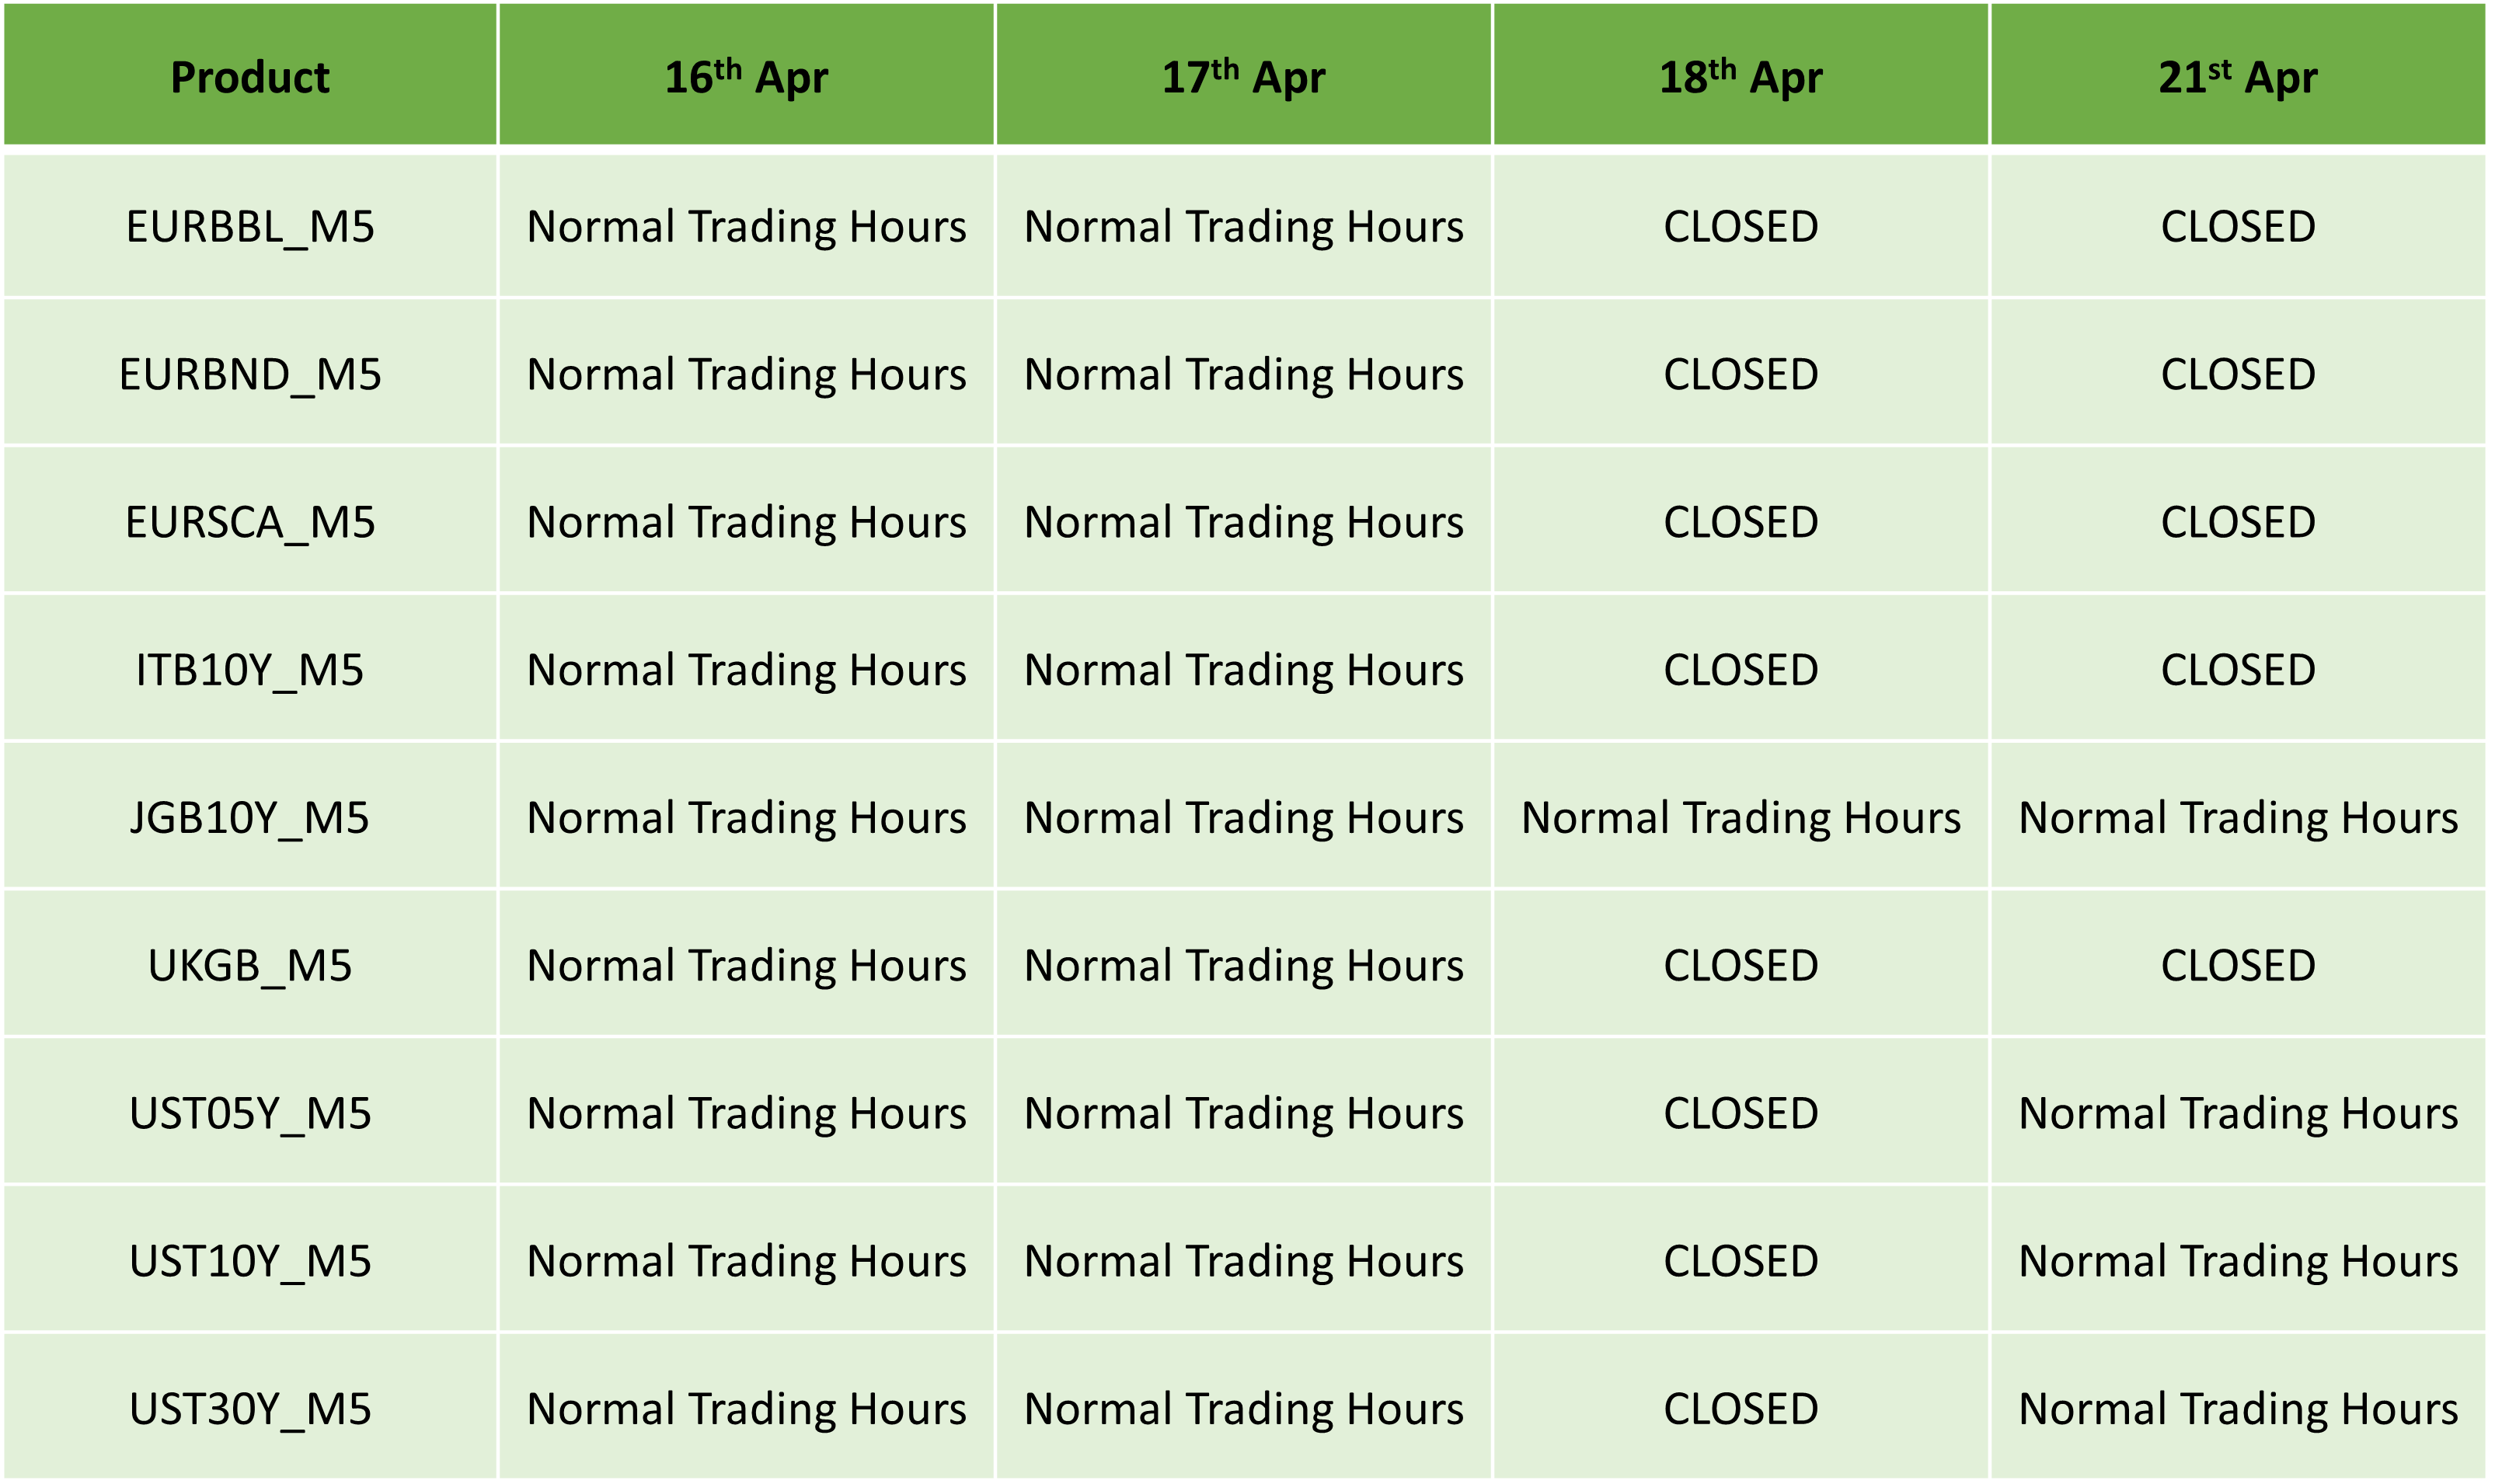
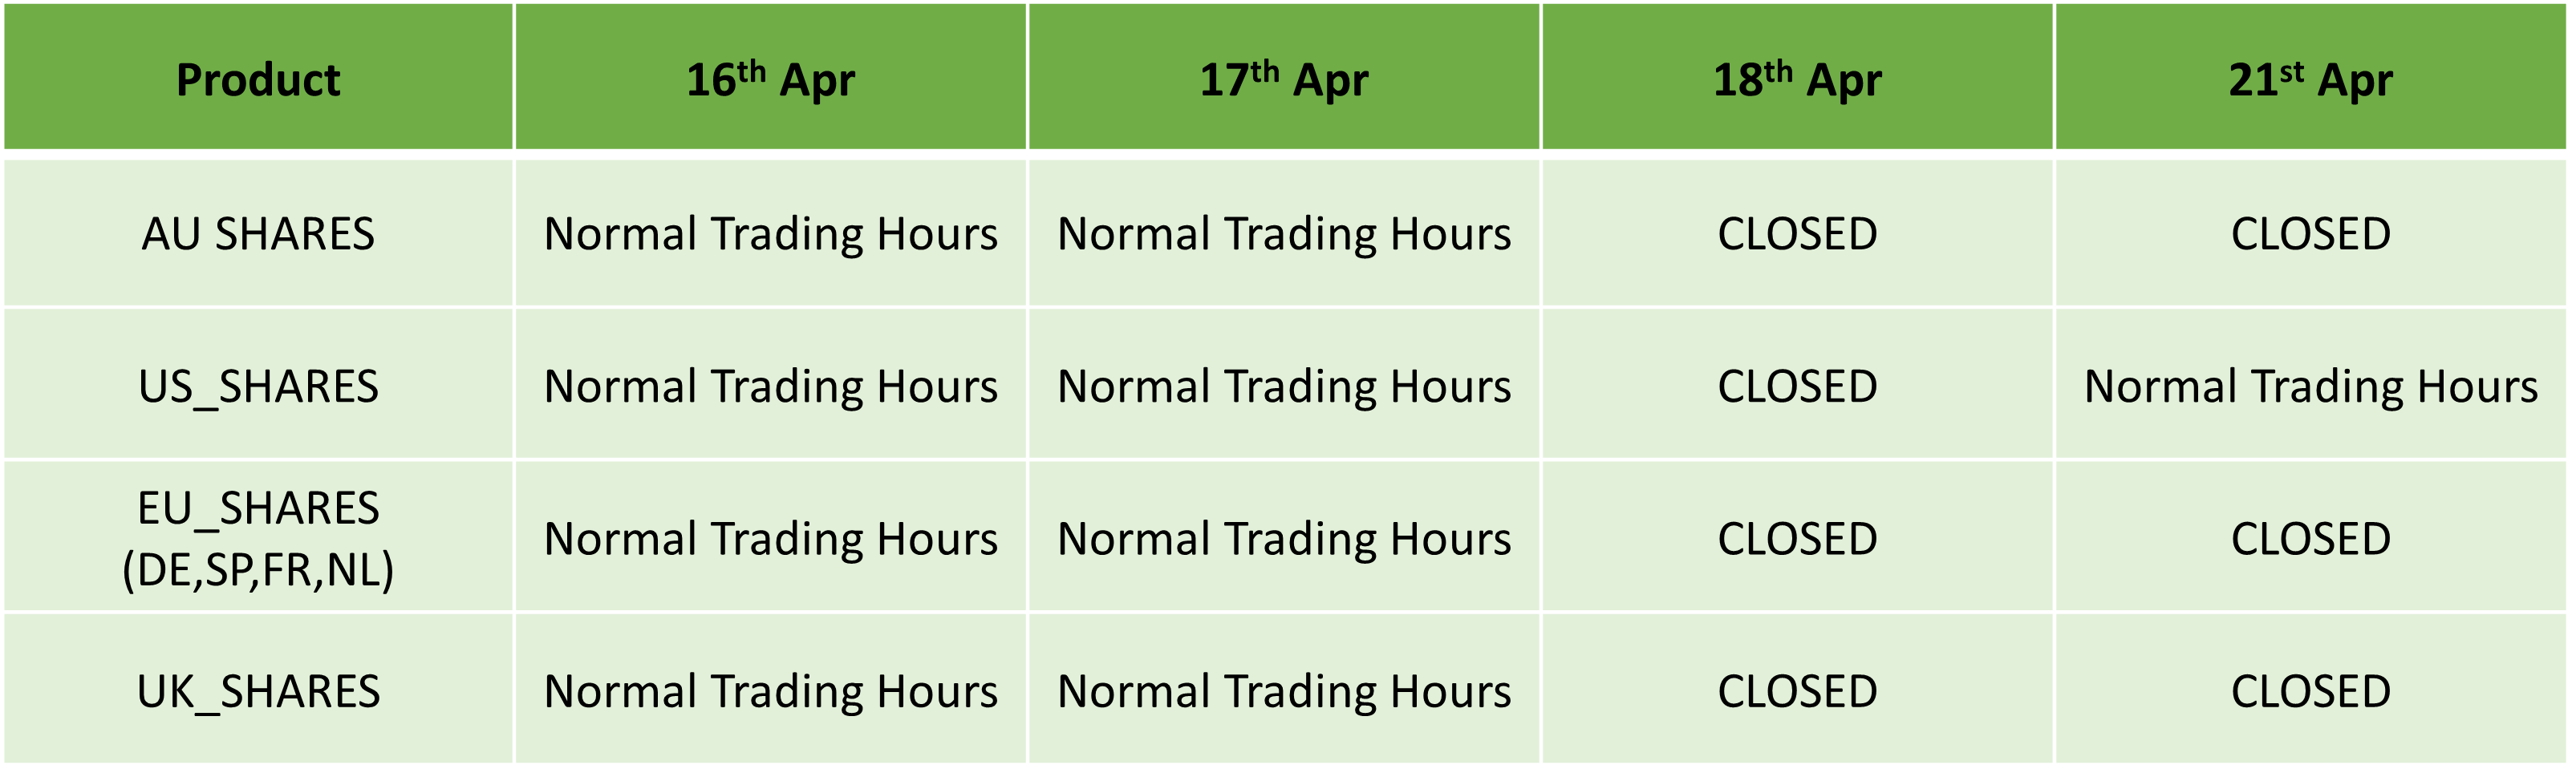
Please find our updated Trading schedule and general information related to the Easter Holidays starting on Wednesday, 16 April, 2025.
Liquidity over the holidays is expected to be particularly thin so please take the necessary precaution to ensure that you are not affected by increased volatility, spreads and intermittent pricing.
All times mentioned below are Platform time (GMT +3).
Forex / Crypto Pairs:
Precious Metals:
Spot Energies:
Indices:
Energy Futures:
Soft Commodities Futures:
Indices Futures:
Bonds Futures:
Equities:
Kind regards,
IC Markets Global.
The post Easter Holidays Trading Schedule 2025 first appeared on IC Markets | Official Blog.
Trump has directed for tariff talks to begin immediately with South Korea, Japan, India
April 14, 2025 13:14 Forexlive Latest News Market News
These are the US’ closest allies, so you’d expect things to progress a little quicker compared to others. Also, the fact that they’re willing to compromise more I guess. Japan will be speaking with the US later this week as noted here previously.
This article was written by Justin Low at www.forexlive.com.
Eurostoxx futures +2.2% in early European trading
April 14, 2025 13:14 Forexlive Latest News Market News
- German DAX futures +2.0%
- UK FTSE futures +1.7%
European equities are once again having to play catch up a little, with Wall Street gains on Friday needing to be taken into account. That comes alongside the hopeful optimism today, with S&P 500 futures seen up 1% currently.
This article was written by Justin Low at www.forexlive.com.
Citi downgrades US equities back to ‘neutral’ from ‘overweight’
April 14, 2025 13:00 Forexlive Latest News Market News
For some context: Citi upgrades US and European equities to ‘overweight’ on tariffs pause
At the same time, they are upgrading their view on Japanese equities to ‘overweight’ from ‘underweight’ and downgrading their view on emerging market equities to ‘underweight’ from ‘neutral’.
This article was written by Justin Low at www.forexlive.com.
IC Markets Europe Fundamental Forecast | 14 April 2025
April 14, 2025 13:00 ICMarkets Market News
IC Markets Europe Fundamental Forecast | 14 April 2025
What happened in the Asia session?
Asian equity markets rose sharply on Monday, with Hong Kong’s Hang Seng index up the most on gains in technology after U.S. authorities signalled that electronics would be temporarily exempt from steep trade tariffs on China, bringing some much-needed relief. However, demand for the greenback remained frail as the dollar index (DXY) floated around 99.50 while spot prices for gold stayed elevated. This precious metal recorded its latest all-time high during this session as it hit $3,245.78/oz.
What does it mean for the Europe & US sessions?
ECOFIN meetings are set to commence on Monday where Finance Ministers from the Euro Area member states will discuss a range of financial issues, such as euro support mechanisms and government finances. The meetings are closed to the press but officials usually talk with reporters throughout the day, providing insights and clarity on the ongoing discussions. Given the backdrop of global trade uncertainties and heightened volatility in financial markets, traders should pay close attention to any developments on the tariff-related actions by this union.
The Dollar Index (DXY)
Key news events today
Fed Governor Waller’s Speech (5:00 pm GMT)
What can we expect from DXY today?
Federal Reserve Governor Christopher Waller will be speaking about the economic outlook at an event hosted by the Chartered Financial Analyst Society of St. Louis. Given his standing as a governor at the Federal Reserve and the ongoing trade policy uncertainties between the U.S. and its major trading partners, market participants will pay close attention to any insights that he may provide during this event.
Central Bank Notes:
- The Board of Governors of the Federal Reserve System voted unanimously to maintain the Federal Funds Rate in a target range of 4.25 to 4.50% on 19 March 2025
- The Committee seeks to achieve maximum employment and inflation at the rate of 2% over the longer run but uncertainty around the economic outlook has increased; the Committee is attentive to the risks to both sides of its dual mandate.
- Recent indicators suggest that economic activity has continued to expand at a solid pace while the unemployment rate has stabilized at a low level in recent months, and labour market conditions remain solid. However, inflation remains somewhat elevated.
- GDP growth forecasts were revised downward for 2025 (1.7% vs. 2.1% in the December projection) while PCE inflation projections have been adjusted slightly higher for 2025, with core inflation expected to reach 2.5%, partly due to tariff-related pressures.
- In assessing the appropriate stance of monetary policy, the Committee will continue to monitor the implications of incoming information for the economic outlook and is prepared to adjust the stance of monetary policy as appropriate if risks emerge that could impede the attainment of its goals.
- Beginning in April, the Committee will slow the pace of decline of its securities holdings by reducing the monthly redemption cap on Treasury securities from $25B to $5B while maintaining the monthly redemption cap on agency debt and agency mortgage-backed securities at $35B.
- The next meeting is scheduled for 6 to 7 May 2025.
Next 24 Hours Bias
Medium Bearish
Gold (XAU)
Key news events today
Fed Governor Waller’s Speech (5:00 pm GMT)
What can we expect from Gold today?
Federal Reserve Governor Christopher Waller will be speaking about the economic outlook at an event hosted by the Chartered Financial Analyst Society of St. Louis. Given his standing as a governor at the Federal Reserve and the ongoing trade policy uncertainties between the U.S. and its major trading partners, market participants will pay close attention to any insights that he may provide during this event. After making its most recent all-time high of $3,245.37/oz last Friday, there is clearly no lack of appetite for this precious metal by investors and traders alike.
Next 24 Hours Bias
Medium Bullish
The Australian Dollar (AUD)
Key news events today
No major news events.
What can we expect from AUD today?
With demand for the greenback eviscerating, the Aussie surged over 5% off last week before closing at 0.6284. This currency pair continued its upward momentum as it climbed above 0.6300 at the beginning of the Asia session.
Central Bank Notes:
- The RBA maintained the cash rate at 4.10% on 1 April, following a 25-basis point reduction on 18 February.
- Inflation has fallen substantially since the peak in 2022, as higher interest rates have been working to bring aggregate demand and supply closer towards balance.
- Recent information suggests that underlying inflation continues to ease in line with the most recent forecasts published in the February Statement on Monetary Policy.
- Private domestic demand appears to be recovering, real household incomes have picked up and there has been an easing in some measures of financial stress. However, businesses in some sectors continue to report that weakness in demand makes it difficult to pass on cost increases to final prices.
- At the same time, a range of indicators suggest that labour market conditions remain tight. Despite a decline in employment in February, measures of labour underutilisation are at relatively low rates and business surveys and liaison suggest that availability of labour is still a constraint for a range of employers. Wage pressures have eased a little more than expected but productivity growth has not picked up and growth in unit labour costs remains high.
- There are notable uncertainties about the outlook for domestic economic activity and inflation. The central projection is for growth in household consumption to continue to increase as income growth rises. But there is a risk that any pick-up in consumption is slower than expected, resulting in continued subdued output growth and a sharper deterioration in the labour market than currently expected.
- Uncertainty about the outlook abroad also remains significant. On the macroeconomic policy front, recent announcements from the U.S. on tariffs are having an impact on confidence globally and this would likely be amplified if the scope of tariffs widens, or other countries take retaliatory measures. Geopolitical uncertainties are also pronounced.
- The Board’s assessment is that monetary policy remains restrictive and the continued decline in underlying inflation is welcome, but there are nevertheless risks on both sides and the Board is cautious about the outlook.
- The Board will rely upon the data and the evolving assessment of risks to guide its decisions and is resolute in its determination to sustainably return inflation to target and will do what is necessary to achieve that outcome.
- The next meeting is on 20 May 2025.
Next 24 Hours Bias
Medium Bullish
The Kiwi Dollar (NZD)
Key news events today
No major news events.
What can we expect from NZD today?
Just like its Pacific neighbour, the Kiwi rallied strongly last week as it gained nearly 4.5%. Strong tailwinds are not showing any signs of letting up as this currency pair raced toward 0.5850 as Asian markets came online.
Central Bank Notes:
- The Monetary Policy Committee (MPC) agreed to reduce the Official Cash Rate (OCR) by 25 basis points bringing it down to 3.50% on 9 April, marking the fifth consecutive rate cut.
- The Committee assessed that annual consumer price inflation remains near the midpoint of the MPC’s 1 to 3% target band while firms’ inflation expectations and core inflation are consistent with inflation remaining at target over the medium term.
- Economic activity has evolved largely as expected since the February Monetary Policy Statement; higher-than-expected export prices and a lower exchange rate have supported primary sector incomes and overall economic growth.
- Although monetary restraint had been removed at pace, household spending and residential investment have remained weak.
- The recently announced increases in global trade barriers weaken the outlook for global economic activity. On balance, these developments create downside risks to the outlook for economic activity and inflation.
- The Committee noted that the increase in tariffs will take time to work through the global economy, but the direct price increases for economies imposing tariffs and the dampening impact of increased economic uncertainty on global demand will occur relatively quickly.
- With CPI inflation close to the mid-point of the target range, significant spare capacity in the economy, and a weaker activity outlook stemming from global trade policy, the Committee agreed that a further reduction in the OCR was appropriate.
- Meanwhile, future policy decisions will be determined by the outlook for inflationary pressure over the medium term.
- The next meeting is on 28 May 2025.
Next 24 Hours Bias
Medium Bullish
The Japanese Yen (JPY)
Key news events today
No major news events.
What can we expect from JPY today?
Demand for safe-haven assets such as the yen continued to press on as USD/JPY tumbled over 2% last week. This currency pair slid toward 143 at the beginning of Monday’s Asia session as the free-fall gained further traction.
Central Bank Notes:
- The Policy Board of the Bank of Japan decided on 19 March, by a unanimous vote, to maintain the following guidelines for money market operations for the inter-meeting period:
- The Bank will encourage the uncollateralized overnight call rate to remain at around 0.5%.
- The Bank will continue its plan to reduce the amount of its monthly outright purchases of JGBs, aiming to reach about 3 trillion yen by January-March 2026.
- Japan’s economy has continued to recover moderately, with some sectors showing improvement. Exports and industrial production have remained relatively stable, while corporate profits continue on an improving trend and business sentiment maintains a favourable level.
- The employment and income situation has shown moderate improvement, with private consumption on a moderately increasing trend despite ongoing impacts from price rises.
- On the price front, the year-on-year rate of increase in the consumer price index (CPI, all items less fresh food) has been in the range of 3.0-3.5% recently. Services prices continue to rise moderately, reflecting factors such as wage increases, while the effects of cost pass-through from past import price rises have diminished.
- Inflation expectations have continued to rise moderately, with underlying CPI inflation gradually increasing toward the price stability target of 2%. The virtuous cycle between wages and prices continues to strengthen, with businesses increasingly reflecting higher costs in selling prices.
- Japan’s economy is expected to maintain growth above its potential rate, supported by moderately growing overseas economies and the intensifying virtuous cycle from income to spending, underpinned by accommodative financial conditions.
- The next meeting is scheduled for 19 June 2025.
Next 24 Hours Bias
Medium Bearish
The Euro (EUR)
Key news events today
ECOFIN Meetings (All Day)
What can we expect from EUR today?
ECOFIN meetings are set to commence on Monday where Finance Ministers from the Euro Area member states will discuss a range of financial issues, such as euro support mechanisms and government finances. The meetings are closed to the press but officials usually talk with reporters throughout the day, providing insights and clarity on the ongoing discussions. Given the backdrop of global trade uncertainties and heightened volatility in financial markets, traders should pay close attention to any developments on the tariff-related actions by this union.
Central Bank Notes:
- The Governing Council reduced the three key ECB interest rates by 25 basis points on 6 March to mark the fifth successive rate cut.
- Accordingly, the interest rate on the main refinancing operations and the interest rates on the marginal lending facility and the deposit facility will be decreased to 2.65%, 2.90% and 2.50% respectively.
- The Council acknowledged that monetary policy was becoming meaningfully less restrictive, easing borrowing costs for businesses and households with inflation projected to average 2.3% in 2025, 1.9% in 2026, and 2.0% in 2027, while core inflation also neared the 2% target.
- Although domestic inflation remains elevated due to delayed wage and price adjustments, wage growth is moderating.
- Economic growth forecasts were revised downward to 0.9% for 2025 and 1.2% for 2026, reflecting weak exports and investment.
- The asset purchase programme (APP) and pandemic emergency purchase programme (PEPP) portfolios are declining at a measured and predictable pace, as the Eurosystem no longer reinvests the principal payments from maturing securities.
- The ECB remains data-dependent and will adjust its policy as needed to ensure inflation stabilizes around its 2% medium-term target without committing to a specific rate path.
- The next meeting is on 17 April 2025.
Next 24 Hours Bias
Medium Bullish
The Swiss Franc (CHF)
Key news events today
No major news events.
What can we expect from CHF today?
Escalating trade tensions between the U.S. and China have sparked intense demand for safe-haven assets such as the Swiss franc with USD/CHF nose diving over 5% last week. This currency pair smashed through 0.8200 on Friday, briefly dropping under 0.8100 – USD/CHF was floating around 0.8150 as Asian markets came online.
Central Bank Notes:
- The SNB eased monetary policy by lowering its key policy rate by 25 basis points, from 0.50% to 0.25% on 20 March 2025, marking the fifth consecutive reduction.
- Underlying inflationary pressure has decreased further this quarter.
- Inflation in the period since the last monetary policy assessment has again been lower than expected, decreasing from 0.7% in November to 0.3% in February, primarily due to lower electricity prices.
- In the shorter term, the new conditional inflation forecast is slightly higher than December: 0.3% for Q2 2025, 0.4% for 2025 overall, and 0.8% for 2026 and 2027, based on the assumption that the SNB policy rate remains at 0.25% over the entire forecast horizon.
- GDP growth in Switzerland remains moderate, with the services sector continuing to show slightly stronger growth, while manufacturing faces challenges.
- The SNB anticipates GDP growth of around 1.0% to 1.5% for 2025.
- The SNB will continue to monitor the situation closely and will adjust its monetary policy if necessary to ensure inflation remains within the range consistent with price stability over the medium term.
- The next meeting is on 19 June 2025.
Next 24 Hours Bias
Medium Bearish
The Pound (GBP)
Key news events today
No major news events.
What can we expect from GBP today?
The pound rallied over 2% last week as escalating trade tensions have caused markets to jettison the greenback. Cable rose above 1.3100 last Friday and it continued its ascend at the beginning of Monday’s Asia session.
Central Bank Notes:
- The Bank of England’s Monetary Policy Committee (MPC) voted by a majority of 8 to 1 to maintain the Bank Rate at 4.50% on 19 March 2025, while one member preferred to reduce it by 25 basis points (bps).
- The MPC also voted unanimously to reduce the stock of UK government bond purchases held for monetary policy purposes and financed by the issuance of central bank reserves, by £100B over the next 12 months to a total of £558B, starting in October 2024. On 18 December 2024, the stock of UK government bonds held for monetary policy purposes was £655B.
- Twelve-month CPI inflation increased to 3.0% in January from 2.5% in December, slightly higher than expected in the February Report; domestic price and wage pressures are moderating, but remain somewhat elevated.
- Although global energy prices have fallen back recently, they remain higher than last year and CPI inflation is still projected to rise to around 3.75% in 2025 Q3. While CPI inflation is expected to fall back thereafter, the Committee will pay close attention to any consequent signs of more lasting inflationary pressures.
- While UK GDP growth estimates have been slightly stronger than expected at the time of the February Monetary Policy Report, business survey indicators generally continue to suggest weakness in growth and particularly in employment intentions. In recent quarters, subdued activity has been judged to reflect both demand and supply factors.
- The labour market had continued to ease, although it was still judged to be broadly in balance – some indicators of employment intentions had deteriorated markedly, to levels consistent with shrinking employment while other indicators, such as the number of vacancies, had not weakened to the same extent.
- Domestic price and wage pressures were moderating, but remained somewhat elevated. A range of indicators suggested that underlying pay growth had eased further in recent months, although annual growth in private sector regular average weekly earnings had picked up to 6.1% in the three months to January.
- Based on the Committee’s evolving view of the medium-term outlook for inflation, a gradual and careful approach to the further withdrawal of monetary policy restraint is appropriate and it will continue to monitor closely the risks of inflation persistence and what the evolving evidence may reveal about the balance between aggregate supply and demand in the economy.
- Monetary policy will need to continue to remain restrictive for sufficiently long until the risks to inflation returning sustainably to the 2% target in the medium term have dissipated further and the Committee will decide the appropriate degree of monetary policy restrictiveness at each meeting.
- The next meeting is on 8 May 2025.
Next 24 Hours Bias
Medium Bullish
The Canadian Dollar (CAD)
Key news events today
No major news events.
What can we expect from CAD today?
The Loonie has strengthened over 2.5% last week, causing USD/CAD to tumble under 1.3900 on Friday. Mounting trade tensions have sparked an intense sell-off in the U.S. dollar and overhead pressures remain firmly intact for this currency pair.
Central Bank Notes:
- The Bank of Canada reduced its target for the overnight rate by 25 basis points bringing it down to 2.75% on 12 March; this marked the seventh consecutive meeting where rates were reduced.
- The bank announced its plan to complete the normalization of its balance sheet, ending quantitative tightening, and will restart asset purchases in early March, beginning gradually so that its balance sheet stabilizes and then grows modestly, in line with growth in the economy.
- The Governing Council noted that the economy grew more than expected in the fourth quarter of last year, spurred by past rate cuts but growth is now expected to slow at the turn of the year due to increasing trade conflict with the United States.
- Employment growth strengthened in November through January and the unemployment rate declined to 6.6%. In February, job growth stalled. While past interest rate cuts have boosted demand for labour in recent months, there are warning signs that heightened trade tensions could disrupt the recovery in the jobs market. Meanwhile, wage growth has shown signs of moderation.
- Inflation remains close to the 2% target. The temporary suspension of the GST/HST lowered some consumer prices, but January’s CPI was slightly firmer than expected at 1.9%. Inflation is expected to increase to about 2½% in March with the end of the tax break. The Bank’s preferred measures of core inflation remain above 2%, mainly because of the persistence of shelter price inflation. Short-term inflation expectations have risen in light of fears about the impact of tariffs on prices.
- While economic growth has come in stronger than expected, the pervasive uncertainty created by continuously changing U.S. tariff threats is restraining consumers’ spending intentions and businesses’ plans to hire and invest.
- While monetary policy cannot offset the impacts of a trade war, the Governing Council will carefully assess the timing and strength of both the downward pressures on inflation from a weaker economy and the upward pressures on inflation from higher costs.
- The Council will also be closely monitoring inflation expectations and is committed to maintaining price stability for Canadians by keeping inflation close to the 2% target.
- The next meeting is on 16 April 2025.
Next 24 Hours Bias
Medium Bearish
Oil
Key news events today
No major news events.
What can we expect from Oil today?
Financial markets continue to remain under pressure and face uncertainties as global trade tensions remain elevated and could possibly escalate once more this week. Energy commodities are expected to face strong headwinds once more as the new trading week gets underway – WTI oil was floating around $61.50 per barrel as Asian markets came online.
Next 24 Hours Bias
Medium Bearish
The post IC Markets Europe Fundamental Forecast | 14 April 2025 first appeared on IC Markets | Official Blog.
IC Markets Asia Fundamental Forecast | 14 April 2025
April 14, 2025 13:00 ICMarkets Market News
IC Markets Asia Fundamental Forecast | 14 April 2025
What happened in the U.S. session?
The Producer Price Index (PPI), which measures wholesale inflation, moderated lower for the second consecutive month in March as both headline and core PPI rose at a slower pace. Headline PPI eased from an annual rate of 3.2% in the previous month to 2.7% while the core reading edged lower from 3.5% to 3.3%. Coupled with slower price gains for consumer prices on Thursday, inflationary pressures in the U.S. are abating. Demand for the greenback continued to plummet as the dollar index (DXY) broke through a key threshold on Friday – it dived under 100 to hit a low of 99.01 before rebounding off this level to close at 99.78.
What does it mean for the Asia Session?
Financial markets continue to remain under pressure and face uncertainties as global trade tensions remain elevated and could possibly escalate once more this week. The DXY hovered around 99.90 at the beginning of this session while spot prices for gold gapped lower at today’s open. After closing at $3,237.53/oz last Friday, this precious metal opened at $3,210.23/oz but rose steadily as it looked to fill this gap. Meanwhile, crude oil prices are likely to face strong headwinds once again this week – WTI oil was floating around $61.50 per barrel.
The Dollar Index (DXY)
Key news events today
Fed Governor Waller’s Speech (5:00 pm GMT)
What can we expect from DXY today?
Federal Reserve Governor Christopher Waller will be speaking about the economic outlook at an event hosted by the Chartered Financial Analyst Society of St. Louis. Given his standing as a governor at the Federal Reserve and the ongoing trade policy uncertainties between the U.S. and its major trading partners, market participants will pay close attention to any insights that he may provide during this event.
Central Bank Notes:
- The Board of Governors of the Federal Reserve System voted unanimously to maintain the Federal Funds Rate in a target range of 4.25 to 4.50% on 19 March 2025
- The Committee seeks to achieve maximum employment and inflation at the rate of 2% over the longer run but uncertainty around the economic outlook has increased; the Committee is attentive to the risks to both sides of its dual mandate.
- Recent indicators suggest that economic activity has continued to expand at a solid pace while the unemployment rate has stabilized at a low level in recent months, and labour market conditions remain solid. However, inflation remains somewhat elevated.
- GDP growth forecasts were revised downward for 2025 (1.7% vs. 2.1% in the December projection) while PCE inflation projections have been adjusted slightly higher for 2025, with core inflation expected to reach 2.5%, partly due to tariff-related pressures.
- In assessing the appropriate stance of monetary policy, the Committee will continue to monitor the implications of incoming information for the economic outlook and is prepared to adjust the stance of monetary policy as appropriate if risks emerge that could impede the attainment of its goals.
- Beginning in April, the Committee will slow the pace of decline of its securities holdings by reducing the monthly redemption cap on Treasury securities from $25B to $5B while maintaining the monthly redemption cap on agency debt and agency mortgage-backed securities at $35B.
- The next meeting is scheduled for 6 to 7 May 2025.
Next 24 Hours Bias
Medium Bearish
Gold (XAU)
Key news events today
Fed Governor Waller’s Speech (5:00 pm GMT)
What can we expect from Gold today?
Federal Reserve Governor Christopher Waller will be speaking about the economic outlook at an event hosted by the Chartered Financial Analyst Society of St. Louis. Given his standing as a governor at the Federal Reserve and the ongoing trade policy uncertainties between the U.S. and its major trading partners, market participants will pay close attention to any insights that he may provide during this event. After making its most recent all-time high of $3,245.37/oz last Friday, there is clearly no lack of appetite for this precious metal by investors and traders alike.
Next 24 Hours Bias
Medium Bullish
The Australian Dollar (AUD)
Key news events today
No major news events.
What can we expect from AUD today?
With demand for the greenback eviscerating, the Aussie surged over 5% off last week before closing at 0.6284. This currency pair continued its upward momentum as it climbed above 0.6300 at the beginning of the Asia session.
Central Bank Notes:
- The RBA maintained the cash rate at 4.10% on 1 April, following a 25-basis point reduction on 18 February.
- Inflation has fallen substantially since the peak in 2022, as higher interest rates have been working to bring aggregate demand and supply closer towards balance.
- Recent information suggests that underlying inflation continues to ease in line with the most recent forecasts published in the February Statement on Monetary Policy.
- Private domestic demand appears to be recovering, real household incomes have picked up and there has been an easing in some measures of financial stress. However, businesses in some sectors continue to report that weakness in demand makes it difficult to pass on cost increases to final prices.
- At the same time, a range of indicators suggest that labour market conditions remain tight. Despite a decline in employment in February, measures of labour underutilisation are at relatively low rates and business surveys and liaison suggest that availability of labour is still a constraint for a range of employers. Wage pressures have eased a little more than expected but productivity growth has not picked up and growth in unit labour costs remains high.
- There are notable uncertainties about the outlook for domestic economic activity and inflation. The central projection is for growth in household consumption to continue to increase as income growth rises. But there is a risk that any pick-up in consumption is slower than expected, resulting in continued subdued output growth and a sharper deterioration in the labour market than currently expected.
- Uncertainty about the outlook abroad also remains significant. On the macroeconomic policy front, recent announcements from the U.S. on tariffs are having an impact on confidence globally and this would likely be amplified if the scope of tariffs widens, or other countries take retaliatory measures. Geopolitical uncertainties are also pronounced.
- The Board’s assessment is that monetary policy remains restrictive and the continued decline in underlying inflation is welcome, but there are nevertheless risks on both sides and the Board is cautious about the outlook.
- The Board will rely upon the data and the evolving assessment of risks to guide its decisions and is resolute in its determination to sustainably return inflation to target and will do what is necessary to achieve that outcome.
- The next meeting is on 20 May 2025.
Next 24 Hours Bias
Medium Bullish
The Kiwi Dollar (NZD)
Key news events today
No major news events.
What can we expect from NZD today?
Just like its Pacific neighbour, the Kiwi rallied strongly last week as it gained nearly 4.5%. Strong tailwinds are not showing any signs of letting up as this currency pair raced toward 0.5850 as Asian markets came online.
Central Bank Notes:
- The Monetary Policy Committee (MPC) agreed to reduce the Official Cash Rate (OCR) by 25 basis points bringing it down to 3.50% on 9 April, marking the fifth consecutive rate cut.
- The Committee assessed that annual consumer price inflation remains near the midpoint of the MPC’s 1 to 3% target band while firms’ inflation expectations and core inflation are consistent with inflation remaining at target over the medium term.
- Economic activity has evolved largely as expected since the February Monetary Policy Statement; higher-than-expected export prices and a lower exchange rate have supported primary sector incomes and overall economic growth.
- Although monetary restraint had been removed at pace, household spending and residential investment have remained weak.
- The recently announced increases in global trade barriers weaken the outlook for global economic activity. On balance, these developments create downside risks to the outlook for economic activity and inflation.
- The Committee noted that the increase in tariffs will take time to work through the global economy, but the direct price increases for economies imposing tariffs and the dampening impact of increased economic uncertainty on global demand will occur relatively quickly.
- With CPI inflation close to the mid-point of the target range, significant spare capacity in the economy, and a weaker activity outlook stemming from global trade policy, the Committee agreed that a further reduction in the OCR was appropriate.
- Meanwhile, future policy decisions will be determined by the outlook for inflationary pressure over the medium term.
- The next meeting is on 28 May 2025.
Next 24 Hours Bias
Medium Bullish
The Japanese Yen (JPY)
Key news events today
No major news events.
What can we expect from JPY today?
Demand for safe-haven assets such as the yen continued to press on as USD/JPY tumbled over 2% last week. This currency pair slid toward 143 at the beginning of Monday’s Asia session as the free-fall gained further traction.
Central Bank Notes:
- The Policy Board of the Bank of Japan decided on 19 March, by a unanimous vote, to maintain the following guidelines for money market operations for the inter-meeting period:
- The Bank will encourage the uncollateralized overnight call rate to remain at around 0.5%.
- The Bank will continue its plan to reduce the amount of its monthly outright purchases of JGBs, aiming to reach about 3 trillion yen by January-March 2026.
- Japan’s economy has continued to recover moderately, with some sectors showing improvement. Exports and industrial production have remained relatively stable, while corporate profits continue on an improving trend and business sentiment maintains a favourable level.
- The employment and income situation has shown moderate improvement, with private consumption on a moderately increasing trend despite ongoing impacts from price rises.
- On the price front, the year-on-year rate of increase in the consumer price index (CPI, all items less fresh food) has been in the range of 3.0-3.5% recently. Services prices continue to rise moderately, reflecting factors such as wage increases, while the effects of cost pass-through from past import price rises have diminished.
- Inflation expectations have continued to rise moderately, with underlying CPI inflation gradually increasing toward the price stability target of 2%. The virtuous cycle between wages and prices continues to strengthen, with businesses increasingly reflecting higher costs in selling prices.
- Japan’s economy is expected to maintain growth above its potential rate, supported by moderately growing overseas economies and the intensifying virtuous cycle from income to spending, underpinned by accommodative financial conditions.
- The next meeting is scheduled for 19 June 2025.
Next 24 Hours Bias
Medium Bearish
The Euro (EUR)
Key news events today
ECOFIN Meetings (All Day)
What can we expect from EUR today?
ECOFIN meetings are set to commence on Monday where Finance Ministers from the Euro Area member states will discuss a range of financial issues, such as euro support mechanisms and government finances. The meetings are closed to the press but officials usually talk with reporters throughout the day, providing insights and clarity on the ongoing discussions. Given the backdrop of global trade uncertainties and heightened volatility in financial markets, traders should pay close attention to any developments on the tariff-related actions by this union.
Central Bank Notes:
- The Governing Council reduced the three key ECB interest rates by 25 basis points on 6 March to mark the fifth successive rate cut.
- Accordingly, the interest rate on the main refinancing operations and the interest rates on the marginal lending facility and the deposit facility will be decreased to 2.65%, 2.90% and 2.50% respectively.
- The Council acknowledged that monetary policy was becoming meaningfully less restrictive, easing borrowing costs for businesses and households with inflation projected to average 2.3% in 2025, 1.9% in 2026, and 2.0% in 2027, while core inflation also neared the 2% target.
- Although domestic inflation remains elevated due to delayed wage and price adjustments, wage growth is moderating.
- Economic growth forecasts were revised downward to 0.9% for 2025 and 1.2% for 2026, reflecting weak exports and investment.
- The asset purchase programme (APP) and pandemic emergency purchase programme (PEPP) portfolios are declining at a measured and predictable pace, as the Eurosystem no longer reinvests the principal payments from maturing securities.
- The ECB remains data-dependent and will adjust its policy as needed to ensure inflation stabilizes around its 2% medium-term target without committing to a specific rate path.
- The next meeting is on 17 April 2025.
Next 24 Hours Bias
Medium Bullish
The Swiss Franc (CHF)
Key news events today
No major news events.
What can we expect from CHF today?
Escalating trade tensions between the U.S. and China have sparked intense demand for safe-haven assets such as the Swiss franc with USD/CHF nose diving over 5% last week. This currency pair smashed through 0.8200 on Friday, briefly dropping under 0.8100 – USD/CHF was floating around 0.8150 as Asian markets came online.
Central Bank Notes:
- The SNB eased monetary policy by lowering its key policy rate by 25 basis points, from 0.50% to 0.25% on 20 March 2025, marking the fifth consecutive reduction.
- Underlying inflationary pressure has decreased further this quarter.
- Inflation in the period since the last monetary policy assessment has again been lower than expected, decreasing from 0.7% in November to 0.3% in February, primarily due to lower electricity prices.
- In the shorter term, the new conditional inflation forecast is slightly higher than December: 0.3% for Q2 2025, 0.4% for 2025 overall, and 0.8% for 2026 and 2027, based on the assumption that the SNB policy rate remains at 0.25% over the entire forecast horizon.
- GDP growth in Switzerland remains moderate, with the services sector continuing to show slightly stronger growth, while manufacturing faces challenges.
- The SNB anticipates GDP growth of around 1.0% to 1.5% for 2025.
- The SNB will continue to monitor the situation closely and will adjust its monetary policy if necessary to ensure inflation remains within the range consistent with price stability over the medium term.
- The next meeting is on 19 June 2025.
Next 24 Hours Bias
Medium Bearish
The Pound (GBP)
Key news events today
No major news events.
What can we expect from GBP today?
The pound rallied over 2% last week as escalating trade tensions have caused markets to jettison the greenback. Cable rose above 1.3100 last Friday and it continued its ascend at the beginning of Monday’s Asia session.
Central Bank Notes:
- The Bank of England’s Monetary Policy Committee (MPC) voted by a majority of 8 to 1 to maintain the Bank Rate at 4.50% on 19 March 2025, while one member preferred to reduce it by 25 basis points (bps).
- The MPC also voted unanimously to reduce the stock of UK government bond purchases held for monetary policy purposes and financed by the issuance of central bank reserves, by £100B over the next 12 months to a total of £558B, starting in October 2024. On 18 December 2024, the stock of UK government bonds held for monetary policy purposes was £655B.
- Twelve-month CPI inflation increased to 3.0% in January from 2.5% in December, slightly higher than expected in the February Report; domestic price and wage pressures are moderating, but remain somewhat elevated.
- Although global energy prices have fallen back recently, they remain higher than last year and CPI inflation is still projected to rise to around 3.75% in 2025 Q3. While CPI inflation is expected to fall back thereafter, the Committee will pay close attention to any consequent signs of more lasting inflationary pressures.
- While UK GDP growth estimates have been slightly stronger than expected at the time of the February Monetary Policy Report, business survey indicators generally continue to suggest weakness in growth and particularly in employment intentions. In recent quarters, subdued activity has been judged to reflect both demand and supply factors.
- The labour market had continued to ease, although it was still judged to be broadly in balance – some indicators of employment intentions had deteriorated markedly, to levels consistent with shrinking employment while other indicators, such as the number of vacancies, had not weakened to the same extent.
- Domestic price and wage pressures were moderating, but remained somewhat elevated. A range of indicators suggested that underlying pay growth had eased further in recent months, although annual growth in private sector regular average weekly earnings had picked up to 6.1% in the three months to January.
- Based on the Committee’s evolving view of the medium-term outlook for inflation, a gradual and careful approach to the further withdrawal of monetary policy restraint is appropriate and it will continue to monitor closely the risks of inflation persistence and what the evolving evidence may reveal about the balance between aggregate supply and demand in the economy.
- Monetary policy will need to continue to remain restrictive for sufficiently long until the risks to inflation returning sustainably to the 2% target in the medium term have dissipated further and the Committee will decide the appropriate degree of monetary policy restrictiveness at each meeting.
- The next meeting is on 8 May 2025.
Next 24 Hours Bias
Medium Bullish
The Canadian Dollar (CAD)
Key news events today
No major news events.
What can we expect from CAD today?
The Loonie has strengthened over 2.5% last week, causing USD/CAD to tumble under 1.3900 on Friday. Mounting trade tensions have sparked an intense sell-off in the U.S. dollar and overhead pressures remain firmly intact for this currency pair.
Central Bank Notes:
- The Bank of Canada reduced its target for the overnight rate by 25 basis points bringing it down to 2.75% on 12 March; this marked the seventh consecutive meeting where rates were reduced.
- The bank announced its plan to complete the normalization of its balance sheet, ending quantitative tightening, and will restart asset purchases in early March, beginning gradually so that its balance sheet stabilizes and then grows modestly, in line with growth in the economy.
- The Governing Council noted that the economy grew more than expected in the fourth quarter of last year, spurred by past rate cuts but growth is now expected to slow at the turn of the year due to increasing trade conflict with the United States.
- Employment growth strengthened in November through January and the unemployment rate declined to 6.6%. In February, job growth stalled. While past interest rate cuts have boosted demand for labour in recent months, there are warning signs that heightened trade tensions could disrupt the recovery in the jobs market. Meanwhile, wage growth has shown signs of moderation.
- Inflation remains close to the 2% target. The temporary suspension of the GST/HST lowered some consumer prices, but January’s CPI was slightly firmer than expected at 1.9%. Inflation is expected to increase to about 2½% in March with the end of the tax break. The Bank’s preferred measures of core inflation remain above 2%, mainly because of the persistence of shelter price inflation. Short-term inflation expectations have risen in light of fears about the impact of tariffs on prices.
- While economic growth has come in stronger than expected, the pervasive uncertainty created by continuously changing U.S. tariff threats is restraining consumers’ spending intentions and businesses’ plans to hire and invest.
- While monetary policy cannot offset the impacts of a trade war, the Governing Council will carefully assess the timing and strength of both the downward pressures on inflation from a weaker economy and the upward pressures on inflation from higher costs.
- The Council will also be closely monitoring inflation expectations and is committed to maintaining price stability for Canadians by keeping inflation close to the 2% target.
- The next meeting is on 16 April 2025.
Next 24 Hours Bias
Medium Bearish
Oil
Key news events today
No major news events.
What can we expect from Oil today?
Financial markets continue to remain under pressure and face uncertainties as global trade tensions remain elevated and could possibly escalate once more this week. Energy commodities are expected to face strong headwinds once more as the new trading week gets underway – WTI oil was floating around $61.50 per barrel as Asian markets came online.
Next 24 Hours Bias
Medium Bearish
The post IC Markets Asia Fundamental Forecast | 14 April 2025 first appeared on IC Markets | Official Blog.
Monday 14th April 2025: Asia-Pacific Stocks Surge as Trump Eases Tariff Pressure
April 14, 2025 12:39 ICMarkets Market News
Global Markets:
- Asian Stock Markets : Nikkei up 1.76%, Shanghai Composite up 0.72%, Hang Seng up 2.01% ASX up 1.34%
- Commodities : Gold at $3242.35 (-0.09%), Silver at $31.47 (-0.08%), Brent Oil at $64.65 (-0.45%), WTI Oil at $61.46 (-0.34%)
- Rates : US 10-year yield at 4.471, UK 10-year yield at 4.7525, Germany 10-year yield at 2.5272
News & Data:
- (USD) Core PPI m/m -0.1% to 0.3% expected
- (USD) PPI m/m -0.4% to 0.2% expected
Markets Update:
Asia-Pacific markets surged Monday after U.S. President Donald Trump paused tariffs on certain consumer electronics, lifting investor sentiment. Hong Kong led regional gains, with the Hang Seng Index climbing 2.31% and the Hang Seng Tech Index rising 2.52%. In mainland China, the CSI 300 edged up 0.47%.
Japan’s Nikkei 225 jumped 1.92%, while the broader Topix index gained 1.63%. South Korea’s Kospi added 0.98%, and the small-cap Kosdaq rose 1.82%. Australia’s S&P/ASX 200 was up 1.35% in late trading. Indian markets were closed due to a public holiday.
The tariff pause includes exemptions on smartphones, computers, semiconductors, and other components, according to U.S. Customs and Border Protection guidance issued late Friday. However, both Trump and Commerce Secretary Howard Lutnick signaled Sunday that the exemptions may be temporary. Trump stated via Truth Social that these items remain “subject to the existing 20% Fentanyl Tariffs” and are now in a different tariff category.
Several Asia-Pacific countries are preparing for trade talks with the U.S. this week. Trump is prioritizing negotiations with key partners like Vietnam, India, South Korea, and Japan as part of efforts to counter China’s influence. Japan’s top trade official Akazawa Ryosei is set to visit the U.S. for discussions with Treasury Secretary Scott Bessent and Trade Representative Jamieson Greer, according to NHK.
U.S. futures also rose, following a strong close last Friday. The S&P 500 climbed 1.81%, the Dow Jones rose 1.56%, and the Nasdaq gained 2.06%.
Upcoming Events:
- 12:30 PM GMT – CAD Wholesale Sales m/m
The post Monday 14th April 2025: Asia-Pacific Stocks Surge as Trump Eases Tariff Pressure first appeared on IC Markets | Official Blog.
Monday 14th April 2025: Technical Outlook and Review
April 14, 2025 12:39 ICMarkets Market News
DXY (US Dollar Index):
Potential Direction: Bearish
Overall momentum of the chart: Bearish
Price could make a bearish continuation toward the 1st support. Additionally, the price is below the bearish Ichimoku cloud, which suggests a bearish trend
Pivot: 100.25
Supporting reasons: Identified as a pullback resistance, indicating a potential area where selling pressures could intensify.
1st support: 97.71
Supporting reasons: Identified as a support that aligns with the 127.2% Fibonacci extension and the 100% Fibonacci projection, indicating a potential area where the price could stabilize once again.
1st resistance: 101.90
Supporting reasons: Identified as a pullback resistance, indicating a potential level that could cap further upward movement.
EUR/USD:
Potential Direction: Bearish
Overall momentum of the chart: Bullish
Price could rise towards the pivot in the short term before reversing off and falling towards 1st support
Pivot: 1.1526
Supporting reasons: Identified as a pullback resistance that aligns with the 100% Fibonacci projection, indicating a potential area where selling pressures could intensify.
1st support: 1.1200
Supporting reasons: Identified as a pullback support, indicating a potential area where the price could stabilize once more.
1st resistance: 1.1686
Supporting reasons: Identified as a pullback resistance, indicating a potential area that could halt any further upward movement.
EUR/JPY:
Potential Direction: Bullish
Overall momentum of the chart: Bearish
Price could potentially make a bullish continuation toward the 1st resistance.
Pivot: 158.18
Supporting reasons: Identified as an overlap support that aligns with the 61.8% Fibonacci retracement, indicating a potential area where buying interests could pick up to stage a rebound.
1st support: 155.55
Supporting reasons: Identified as a swing low support, indicating a potential area where the price could stabilize once again.
1st resistance: 168.11
Supporting reasons: Identified as a pullback resistance that aligns close to the 161.8% Fibonacci extension and the 61.8% Fibonacci retracement, indicating a potential area that could halt any further upward movement.
EUR/GBP:
Potential Direction: Bullish
Overall momentum of the chart: Bullish
Price could fall toward the pivot and potentially make a bullish bounce off this level to rise toward the 1st resistance.
Pivot: 0.8613
Supporting reasons: Identified as a pullback support, indicating a potential area where buying interests could pick up to stage a rebound.
1st support: 0.8490
Supporting reasons: Identified as a pullback support, indicating a potential area where the price could stabilize once more.
1st resistance: 0.8754
Supporting reasons: Identified as a multi swing high resistance that aligns close to the 127.2% Fibonacci extension, indicating a potential level that could cap further upward movement.
GBP/USD:
Potential Direction: Bearish
Overall momentum of the chart: Bullish
Price could rise toward the pivot and potentially make a bearish reversal off this level to fall toward the 1st support.
Pivot: 1.3258
Supporting reasons: Identified as a pullback resistance, indicating a potential area where selling pressures could intensify.
1st support: 1.3040
Supporting reasons: Identified as a pullback support, acting as a potential level where the price could stabilize once again.
1st resistance: 1.3412
Supporting reasons: Identified as a multi-swing high resistance, indicating a potential level that could cap further upward movement.
GBP/JPY:
Potential Direction: Bearish
Overall momentum of the chart: Bearish
Price could potentially make a bearish continuation toward the 1st support.
Pivot: 189.78
Supporting reasons: Identified as an overlap resistance, indicating a potential area where selling pressures could intensify.
1st support: 183.04
Supporting reasons: Identified as a swing low support, indicating a potential level where the price could stabilize once more.
1st resistance: 194.70
Supporting reasons: Identified as an overlap resistance, indicating a potential level that could cap further upward movement.
USD/CHF:
Potential Direction: Bearish
Overall momentum of the chart: Bearish
Price could rise towards the pivot in the short term before reversing off and falling towards 1st support
Pivot: 0.8370
Supporting reasons: Identified as a pullback resistance, indicating a potential area where selling pressures could intensify.
1st support: 0.7860
Supporting reasons: Identified as a support that aligns with the 161.8% Fibonacci extension, indicating a potential level where the price could stabilize once again.
1st resistance: 0.8723
Supporting reasons: Identified as a pullback resistance, indicating a potential level that could cap further upward movement.
USD/JPY:
Potential Direction: Bullish
Overall momentum of the chart: Bearish
Price could fall toward the pivot and potentially make a bullish bounce off this level to rise toward the 1st resistance.
Pivot: 142.01
Supporting reasons: Identified as a swing low support that aligns with the 78.6% Fibonacci projection and the 100% Fibonacci projection, indicating a potential area where buying interests could pick up to stage a rebound.
1st support: 137.93
Supporting reasons: Identified as an overlap support, suggesting a potential area where the price could stabilize once more.
1st resistance: 147.17
Supporting reasons: Identified as a pullback resistance, indicating a potential level that could cap further upward movement.
USD/CAD:
Potential Direction: Bullish
Overall momentum of the chart: Bearish
Price could fall toward the pivot and potentially make a bullish bounce off this level to rise toward the 1st resistance.
Pivot: 1.3817
Supporting reasons: Identified as a swing-low support, indicating a potential area where buying interests could pick up to stage a minor rebound.
1st support: 1.3610
Supporting reasons: Identified as a pullback support, indicating a key level where the price could stabilize once more.
1st resistance: 1.3946
Supporting reasons: Identified as an overlap resistance that aligns with a 23.6% Fibonacci retracement, indicating a potential area that could halt any further upward movement. The presence of the red Ichimoku Cloud adds further significance to the strength of the bearish momentum.
AUD/USD:
Potential Direction: Bearish
Overall momentum of the chart: Bullish
Price could rise toward the pivot and potentially make a bearish reversal off this level to pull back toward the 1st support.
Pivot: 0.6404
Supporting reasons: Identified as a multi-swing-high resistance, indicating a potential area where selling pressures could intensify.
1st support: 0.6205
Supporting reasons: Identified as a pullback support, suggesting a potential area where the price could stabilize once again.
1st resistance: 0.6537
Supporting reasons: Identified as an overlap resistance that aligns close to a 127.2% Fibonacci extension, indicating a potential area that could halt any further upward movement.
NZD/USD
Potential Direction: Bearish
Overall momentum of the chart: Bullish
Price is rising toward the pivot and could potentially make a bearish reversal off this level to pull back toward the 1st support.
Pivot: 0.5911
Supporting reasons: Identified as an overlap resistance that aligns close to a 50% Fibonacci retracement, indicating a potential area where selling pressures could intensify.
1st support: 0.5794
Supporting reasons: Identified as a pullback support, suggesting a potential area where the price could stabilize once more.
1st resistance: 0.6025
Supporting reasons: Identified as a swing-high resistance that aligns close to a 61.8% Fibonacci retracement, indicating a potential area that could halt any further upward movement.
US30 (DJIA):
Potential Direction: Bearish
Overall momentum of the chart: Bearish
Price could rise toward the pivot and potentially make a bearish reversal off this level to fall toward the 1st support.
Pivot: 40,856.80
Supporting reasons: Identified as an overlap resistance, indicating a potential area where selling pressures could intensify. The presence of the red Ichimoku Cloud adds further significance to the strength of the bearish momentum.
1st support: 39,550.00
Supporting reasons: Identified as a swing-low support, indicating a potential level where the price could stabilize once again.
1st resistance: 42,629.60
Supporting reasons: Identified as a swing-high resistance, indicating a potential area that could halt any further upward movement.
DE40 (DAX):
Potential Direction: Bullish
Overall momentum of the chart: Bearish
Price could fall toward the pivot and potentially make a bullish bounce off this level to rise toward the 1st resistance.
Pivot: 19,513.29
Supporting reasons: Identified as a swing-low support that aligns close to a 78.6% Fibonacci retracement, indicating a potential area where buying interests could pick up to stage a minor rebound.
1st support: 18,262.80
Supporting reasons: Identified as a swing-low support that aligns close to a 78.6% Fibonacci retracement, indicating a key level where the price could stabilize once more.
1st resistance: 21,523.30
Supporting reasons: Identified as a swing-high resistance that aligns close to a 61.8% Fibonacci retracement, indicating a potential area that could halt any further upward movement.
US500 (S&P 500):
Potential Direction: Bearish
Overall momentum of the chart: Bearish
Price could rise toward the pivot and potentially make a bearish reversal off this level to fall toward the 1st support.
Pivot: 5,528.60
Supporting reasons: Identified as a pullback resistance, indicating a potential area where selling pressures could intensify. The presence of the red Ichimoku Cloud adds further significance to the strength of the bearish momentum.
1st support: 5,263.40
Supporting reasons: Identified as a swing-low support, indicating a potential level where the price could stabilize once again.
1st resistance: 5,785.00
Supporting reasons: Identified as a swing-high resistance, indicating a potential area that could halt any further upward movement.
BTC/USD (Bitcoin):
Potential Direction: Bearish
Overall momentum of the chart: Neutral
Price could rise toward the pivot and potentially make a bearish reversal off this level to fall toward the 1st support.
Pivot: 88,147.57
Supporting reasons: Identified as a multi-swing-high resistance that aligns with a 38.2% Fibonacci retracement, indicating a potential area where selling pressures could intensify. The presence of the red Ichimoku Cloud adds further significance to the strength of the bearish momentum.
1st support: 76,555.03
Supporting reasons: Identified as a multi-swing-low support, indicating a potential level where the price could stabilize once more.
1st resistance: 94,030.59
Supporting reasons: Identified as an overlap resistance, indicating a potential area that could halt any further upward movement.
ETH/USD (Ethereum):
Potential Direction: Bearish
Overall momentum of the chart: Bearish
Price could rise toward the pivot and potentially make a bearish reversal off this level to fall toward the 1st support.
Pivot: 1,808.68
Supporting reasons: Identified as a pullback resistance, indicating a potential area where selling pressures could intensify. The presence of the red Ichimoku Cloud adds further significance to the strength of the bearish momentum.
1st support: 1,456.05
Supporting reasons: Identified as a swing-low support, indicating a potential level where the price could stabilize once again.
1st resistance: 2,102.09
Supporting reasons: Identified as an overlap resistance, indicating a potential area that could halt any further upward movement.
WTI/USD (Oil):
Potential Direction: Bearish
Overall momentum of the chart: Bearish
Price could rise toward the pivot and potentially make a bearish reversal off this level to fall toward the 1st support.
Pivot: 62.70
Supporting reasons: Identified as a swing-high resistance, indicating a potential area where selling pressures could intensify. The presence of the red Ichimoku Cloud adds further significance to the strength of the bearish momentum.
1st support: 57.62
Supporting reasons: Identified as a swing-low support, indicating a key level where the price could stabilize once more.
1st resistance: 65.96
Supporting reasons: Identified as a pullback resistance that aligns close to a 61.8% Fibonacci retracement, indicating a potential area that could halt any further upward movement.
XAU/USD (GOLD):
Potential Direction: Bearish
Overall momentum of the chart: Bullish
Price could rise towards the pivot in the short term before reversing off and falling towards 1st support
Pivot: 3299.27
Supporting reasons: Identified as a resistance that aligns with the 161.8% Fibonacci extension, indicating a potential area where selling pressures could intensify.
1st support: 3137.70
Supporting reasons: Identified as a pullback support, acting as a potential level where price could stabilize once again.
1st resistance: 3513.76
Supporting reasons: Identified as a resistance that aligns with the 100% Fibonacci projection, indicating a potential area that could halt any further upward movement.
The accuracy, completeness and timeliness of the information contained on this site cannot be guaranteed. IC Markets does not warranty, guarantee or make any representations, or assume any liability regarding financial results based on the use of the information in the site.
News, views, opinions, recommendations and other information obtained from sources outside of www.icmarkets.com, used in this site are believed to be reliable, but we cannot guarantee their accuracy or completeness. All such information is subject to change at any time without notice. IC Markets assumes no responsibility for the content of any linked site.
The fact that such links may exist does not indicate approval or endorsement of any material contained on any linked site. IC Markets is not liable for any harm caused by the transmission, through accessing the services or information on this site, of a computer virus, or other computer code or programming device that might be used to access, delete, damage, disable, disrupt or otherwise impede in any manner, the operation of the site or of any user’s software, hardware, data or property.
The post Monday 14th April 2025: Technical Outlook and Review first appeared on IC Markets | Official Blog.
Dollar selling cools slightly to start the new week
April 14, 2025 12:30 Forexlive Latest News Market News
The dollar is keeping more mixed ahead of European trading today, with the intense selling from last week cooling off slightly. USD/JPY is still seen down 0.2% to 143.23 but well off the lows of 142.25 earlier in the day. Meanwhile, EUR/USD is flat at 1.1355 currently. While not my favourite indicator of sentiment, the dollar index is meeting a critical technical juncture in the past week:
It is testing the lows from July 2023 with the greenback haven’t been this disliked since the aftermath of the Covid pandemic.
Amid Trump’s garbled approach on tariffs, it is making it tough for investors to gain much confidence about the dollar at the moment. That speaks a lot to the extent of the disdain for the dollar especially in times when markets are seeking safe havens and Treasury yields blowing up.
As things stand, the dollar continues to be reliant on the same factors impacting broader market sentiment at the moment. And that is having to move with the flow of trade/tariffs developments.
So far today, the selling has cooled a little bit. But the danger remains ever present as further escalation by either the US or China risks keeping the dollar in this tailspin for longer.
This article was written by Justin Low at www.forexlive.com.
China president Xi arrives in Hanoi
April 14, 2025 12:00 Forexlive Latest News Market News
As a reminder, he will be busy visiting Vietnam, Malaysia, and Cambodia from 14 to 18 April. That is indirectly saying that the ball is over to Trump’s side of the court as Xi will keep doing his own thing in the meantime. And so, the game of chicken continues with both sides still engaged in a bit of dance right now.
Trump’s latest move is to separate out electronics and semiconductors to a different tariffs bucket. Meanwhile, China is seen pushing for restricting rare earth mineral exports here.
This article was written by Justin Low at www.forexlive.com.
Ex-Dividend 14/4/2025
April 14, 2025 12:00 ICMarkets Market News
|
1
|
Ex-Dividends | ||
|---|---|---|---|
|
2
|
14/4/2025 | ||
|
3
|
Indices | Name |
Index Adjustment Points
|
|
4
|
Australia 200 CFD
|
AUS200 | – |
|
5
|
IBEX-35 Index | ES35 | – |
|
6
|
France 40 CFD | F40 | – |
|
7
|
Hong Kong 50 CFD
|
HK50 | – |
|
8
|
Italy 40 CFD | IT40 | – |
|
9
|
Japan 225 CFD
|
JP225 | – |
|
10
|
EU Stocks 50 CFD
|
STOXX50 | – |
|
11
|
UK 100 CFD | UK100 | – |
|
12
|
US SP 500 CFD
|
US500 | 0.01 |
|
13
|
Wall Street CFD
|
US30 | – |
|
14
|
US Tech 100 CFD
|
USTEC | – |
|
15
|
FTSE CHINA 50
|
CHINA50 | – |
|
16
|
Canada 60 CFD
|
CA60 | – |
|
17
|
Germany Tech 40 CFD
|
TecDE30 | – |
|
18
|
Germany Mid 50 CFD
|
MidDE50 | – |
|
19
|
Netherlands 25 CFD
|
NETH25 | – |
|
20
|
Switzerland 20 CFD
|
SWI20 | – |
|
21
|
Hong Kong China H-shares CFD
|
CHINAH | – |
|
22
|
Norway 25 CFD
|
NOR25 | – |
|
23
|
South Africa 40 CFD
|
SA40 | – |
|
24
|
Sweden 30 CFD
|
SE30 | – |
|
25
|
US 2000 CFD | US2000 | 0.03 |
The post Ex-Dividend 14/4/2025 first appeared on IC Markets | Official Blog.