Articles

Monday 10th March 2025: Asia-Pacific Markets Mixed as Global Trade Uncertainty Continues
413228 March 10, 2025 14:00 ICMarkets Market News
Global Markets:
- Asian Stock Markets : Nikkei up 0.55%, Shanghai Composite down 0.58%, Hang Seng down 2.26% ASX up 0.17%
- Commodities : Gold at $2914.35 (0.19%), Silver at $32.85 (0.08%), Brent Oil at $69.5 (-0.85%), WTI Oil at $66.58 (-0.94%)
- Rates : US 10-year yield at 4.283, UK 10-year yield at 4.6475, Germany 10-year yield at 2.8350
News & Data:
- (USD) Non-Farm Employment Change 151K to 159K expected
- (USD) Unemployment Rate 4.1% to 4.0% expected
- (CAD) Unemployment Rate 6.6% to 6.7% expected
- (CAD) Employment Change 1.1K to 19.7K expected
Markets Update:
Asia-Pacific markets were mixed on Monday after a volatile global trading week. U.S. stocks were expected to open lower, continuing their uncertain trend amid concerns over President Trump’s tariff policies and their impact on economic growth and inflation. Investors closely monitored steel manufacturers ahead of the 25% U.S. tariff on steel and aluminum imports set to begin Wednesday.
Japan’s Nikkei 225 rose 0.24% despite choppy trading, while the broader Topix index fell 0.26%, reversing earlier gains. South Korea’s Kospi gained 0.47%, and the Kosdaq increased 0.53%. Australia’s S&P/ASX 200 climbed 0.24% after reaching a six-month high in its previous session. Hong Kong’s Hang Seng Index dropped 2.11%, while China’s CSI 300 declined 0.83%. Over the weekend, China’s consumer inflation turned negative for the first time in 13 months, with the consumer price index falling 0.7% in February.
China also announced retaliatory tariffs on Canadian agricultural goods after Ottawa imposed import duties on Chinese-made electric vehicles, steel, and aluminum last year. A 100% tariff was placed on Canadian rapeseed oil, oil cakes, and peas, while aquatic products and pork faced a 25% levy. In India, the Nifty 50 rose 0.32%, and the BSE Sensex climbed 0.43%.
In the U.S., major indexes closed higher on Friday despite market volatility. The S&P 500 gained 0.55%, while the Nasdaq Composite rose 0.7%. The Dow Jones added 222.64 points, or 0.52%, ending at 42,801.72. However, trade policy concerns made it the worst week in months for the markets.
Upcoming Events:
- 11:50 PM GMT – JPY Final GDP q/q
The post Monday 10th March 2025: Asia-Pacific Markets Mixed as Global Trade Uncertainty Continues first appeared on IC Markets | Official Blog.
IC Markets Europe Fundamental Forecast | 10 March 2025
413227 March 10, 2025 14:00 ICMarkets Market News
IC Markets Europe Fundamental Forecast | 10 March 2025
What happened in the Asia session?
It was a relatively quiet session as the dollar index (DXY) slid toward 103.50 while spot prices for gold floated around $2,910/oz by midday in Asia. With no major data releases for the rest of the day apart from industrial production activity in Germany and U.S. consumer inflation expectations, headlines could once again be dominated by the ongoing global tariffs debate between the U.S. and its major trading partners such as Canada, Mexico, China and the European Union.
What does it mean for the Europe & US sessions?
Industrial production in Germany declined by 2.4% in December, dragged down by the automotive industry; and machine maintenance and assembly. Not only did output fall more than the forecast of a 0.6% drop, but it also marked the steepest decrease since July. However, January’s estimate points to a relatively strong rebound of 1.6% – a result that could boost the Euro before the start of the European trading hours.
The Dollar Index (DXY)
Key news events today
NY Fed Consumer Inflation Expectations (3:00 pm GMT)
What can we expect from DXY today?
Consumer inflation expectations for the year ahead remained at 3.0% for a third consecutive month in January as price expectations rose across for gas; food; medical care; college; and rent. In addition, median home price growth expectations also rose as mortgage rates declined over this period. Inflation expectations could increase in February as the recent consumer confidence survey highlighted a surge from 5.2% to 6.0%, a result that could lift the greenback.
Central Bank Notes:
- The Board of Governors of the Federal Reserve System voted unanimously to maintain the Federal Funds Rate in a target range of 4.25 to 4.50% on 29 January.
- The Committee seeks to achieve maximum employment and inflation at the rate of 2% over the longer run and judges that the risks to achieving its employment and inflation goals are roughly in balance. The economic outlook is uncertain, and the Committee is attentive to the risks to both sides of its dual mandate.
- Recent indicators suggest that economic activity has continued to expand at a solid pace while the unemployment rate has stabilized at a low level in recent months, and labour market conditions remain solid. However, inflation remains somewhat elevated.
- December’s Summary of Economic Projections (SEP) now indicates just two rate cuts in 2025 totalling 50 bps, compared to the full percentage point of reductions projected in the previous quarter.
- GDP growth forecasts were revised upward for 2024 (2.5% vs. 2% in the September projection) and 2025 (2.1% vs. 2%), while remaining steady at 2% for 2026. Similarly, PCE inflation projections have been adjusted higher for 2024 (2.4% vs. 2.3%), 2025 (2.5% vs. 2.1%), and 2026 (2.1% vs. 2%).
- In assessing the appropriate stance of monetary policy, the Committee will continue to monitor the implications of incoming information for the economic outlook and would be prepared to adjust the stance of monetary policy as appropriate if risks emerge that could impede the attainment of the Committee’s goals.
- The Committee will roll over at auction the amount of principal payments from the Federal Reserve’s holdings of Treasury securities maturing in each calendar month that exceeds a cap of $25 billion per month and redeem Treasury coupon securities up to this monthly cap and Treasury bills to the extent that coupon principal payments are less than the monthly cap.
- In addition, the Committee will reinvest the amount of principal payments from the Federal Reserve’s holdings of agency debt and agency mortgage-backed securities (MBS) received in each calendar month that exceeds a cap of $35 billion per month into Treasury securities to roughly match the maturity composition of Treasury securities outstanding.
- The next meeting runs from 18 to 19 March 2025.
Next 24 Hours Bias
Medium Bearish
Gold (XAU)
Key news events today
NY Fed Consumer Inflation Expectations (3:00 pm GMT)
What can we expect from Gold today?
Consumer inflation expectations for the year ahead remained at 3.0% for a third consecutive month in January as price expectations rose across for gas; food; medical care; college; and rent. In addition, median home price growth expectations also rose as mortgage rates declined over this period. Inflation expectations could increase in February as the recent consumer confidence survey highlighted a surge from 5.2% to 6.0%, a result that could continue to keep gold prices elevated.
Next 24 Hours Bias
Medium Bullish
The Australian Dollar (AUD)
Key news events today
No major news events.
What can we expect from AUD today?
After tumbling 2.3% in the prior week, the Aussie rebounded 1.5% as it rallied above 0.6300. After closing at 0.6304 last Friday, this currency pair was rising steadily toward 0.6350 and it is likely to remain elevated.
Central Bank Notes:
- The RBA reduced the cash rate by 25 basis points to bring it down to 4.10% on 18 February, marking the first rate cut since November 2020.
- Financial conditions are restrictive, which is weighing on demand and is helping to bring down underlying inflation; growth in private demand has been subdued.
- Underlying inflation has moderated over the past three quarters with trimmed mean inflation easing to 3.2% over 2024 and it is expected to reach the 2–3% target range in early 2025, which is sooner than expected at the time of the November Statement.
- The unemployment rate declined a little in late 2024 to 4% with much of the strength in the labour market underpinned by strong employment growth, which has also bolstered household incomes.
- The announcement of tariffs between the United States and other major economies poses challenges to the global outlook but the scale and incidence of the tariffs and their effects remain highly uncertain – which may itself delay some investment until the outlook becomes clearer.
- Economic activity strengthened in China but growth there is still facing structural headwinds while domestic economic growth is forecast to pick up and the labour market is forecast to remain tight.
- If the cash rate follows the market path, underlying inflation is projected to be a little above 2.5% over most of the forecast period. The anticipated recovery of GDP growth and lingering tightness in labour market conditions are expected to sustain some upward pressure on inflation.
- Sustainably returning inflation to target within a reasonable timeframe remains the Board’s highest priority. This is consistent with the RBA’s mandate for price stability and full employment.
- The Board will continue to rely upon the data and the evolving assessment of risks to guide its decisions, paying close attention to developments in the global economy and financial markets, trends in domestic demand, and the outlook for inflation and the labour market.
- The next meeting is on 1 April 2025.
Next 24 Hours Bias
Medium Bullish
The Kiwi Dollar (NZD)
Key news events today
No major news events.
What can we expect from NZD today?
The Kiwi rallied nearly 2% last week as it soared above 0.5750 before closing at 0.5707 on Friday. This currency pair edged higher towards 0.5750 after markets re-opened today.
Central Bank Notes:
- The Monetary Policy Committee (MPC) agreed to reduce the Official Cash Rate (OCR) by 50 basis points bringing it down to 3.75% on 19 February, marking the fourth consecutive rate cut.
- The Committee assessed that annual consumer price inflation remains near the midpoint of the MPC’s 1 to 3% target band; inflation expectations are at target and core inflation continues to fall towards the target mid-point.
- Economic activity in New Zealand remains subdued and with spare productive capacity, domestic inflation pressures continue to ease. Price and wage-setting behaviours are adapting to a low-inflation environment while the price of imports has fallen, also contributing to lower headline inflation.
- Economic growth is expected to recover during 2025 as lower interest rates will encourage spending, although elevated global economic uncertainty is expected to weigh on business investment decisions. Higher prices for some key commodities and a lower exchange rate will increase export revenues and employment growth is expected to pick up in the second half of the year as the domestic economy recovers.
- Global economic growth is expected to remain subdued in the near term as geopolitics, including uncertainty about trade barriers, is likely to weaken global growth. Global economic activity is also likely to remain fragile over the medium term given increasing geoeconomic fragmentation.
- Consumer price inflation is expected to be volatile in the near term, due to a lower exchange rate and higher petrol prices. Nevertheless, the Committee is well placed to maintain price stability over the medium term.
- The economic outlook remains consistent with inflation remaining in the band over the medium term, giving the Committee confidence to continue lowering the OCR. If economic conditions continue to evolve as projected, the Committee has scope to lower the OCR further through 2025.
- The next meeting is on 9 April 2025.
Next 24 Hours Bias
Medium Bullish
The Japanese Yen (JPY)
Key news events today
No major news events.
What can we expect from JPY today?
The yen saw strong inflows as it appreciated strongly versus the greenback. Demand for safe-haven currencies such as the yen amidst the backdrop of global trade uncertainties drove USD/JPY under 147 last week before closing at 148.02 last Friday. This currency pair drifted lower toward 147 once more at the beginning of the Asia session.
Central Bank Notes:
- The Policy Board of the Bank of Japan decided on 24 January, by an 8-1 majority vote, to set the following guidelines for money market operations for the inter-meeting period:
- The Bank will encourage the uncollateralized overnight call rate to remain at around 0.5%.
- The Bank will embark on a plan to reduce the amount of its monthly outright purchases of JGBs so that it will be about 3 trillion yen in January-March 2026; the amount will be cut down by about 400 billion yen each calendar quarter in principle.
- Japan’s economy has recovered moderately, although some weakness has been seen in part. Exports and industrial production have been more or less flat while corporate profits have been on an improving trend and business sentiment has stayed at a favourable level.
- The employment and income situation has improved moderately while private consumption has been on a moderately increasing trend despite the impact of price rises and other factors.
- On the price front, the year-on-year rate of increase in the consumer price index (CPI, all items less fresh food) has been at around 3% recently, as services prices have continued to rise moderately, reflecting factors such as wage increases, although the effects of a pass-through to consumer prices of cost increases led by the past rise in import prices have waned.
- Inflation expectations have risen moderately while underlying CPI inflation has been increasing gradually toward the price stability target of 2%. With wages continuing to rise, there has been an increase in moves to reflect higher costs, such as increased personnel expenses and distribution costs, in selling prices.
- Japan’s economy is likely to keep growing at a pace above its potential growth rate, with overseas economies continuing to grow moderately and as a virtuous cycle from income to spending gradually intensifies against the background of factors such as accommodative financial conditions.
- The next meeting is on 19 March 2025.
Next 24 Hours Bias
Medium Bearish
The Euro (EUR)
Key news events today
Germany Industrial Production (7:00 am GMT)
What can we expect from EUR today?
Industrial production in Germany declined by 2.4% in December, dragged down by the automotive industry; and machine maintenance and assembly. Not only did output fall more than the forecast of a 0.6% drop, but it also marked the steepest decrease since July. However, January’s estimate points to a relatively strong rebound of 1.6% – a result that could boost the Euro before the start of the European trading hours.
Central Bank Notes:
- The Governing Council reduced the three key ECB interest rates by 25 basis points on 6 March to mark the fifth successive rate cut.
- Accordingly, the interest rate on the main refinancing operations and the interest rates on the marginal lending facility and the deposit facility will be decreased to 2.65%, 2.90% and 2.50% respectively.
- The Council acknowledged that monetary policy was becoming meaningfully less restrictive, easing borrowing costs for businesses and households with inflation projected to average 2.3% in 2025, 1.9% in 2026, and 2.0% in 2027, while core inflation also neared the 2% target.
- Although domestic inflation remains elevated due to delayed wage and price adjustments, wage growth is moderating.
- Economic growth forecasts were revised downward to 0.9% for 2025 and 1.2% for 2026, reflecting weak exports and investment.
- The asset purchase programme (APP) and pandemic emergency purchase programme (PEPP) portfolios are declining at a measured and predictable pace, as the Eurosystem no longer reinvests the principal payments from maturing securities.
- The ECB remains data-dependent and will adjust its policy as needed to ensure inflation stabilizes around its 2% medium-term target without committing to a specific rate path.
- The next meeting is on 17 April 2025.
Next 24 Hours Bias
Medium Bullish
The Swiss Franc (CHF)
Key news events today
No major news events.
What can we expect from CHF today?
Demand for safe-haven currencies such as the franc amidst the backdrop of global trade uncertainties caused USD/CHF to dive under 0.8800 last week. This currency pair slid toward 0.8750 as Asian markets came online.
Central Bank Notes:
- The SNB eased monetary policy by lowering its key policy rate by 50 basis points, going from 1.00% to 0.50% on 12 December, marking the fourth consecutive reduction.
- Underlying inflationary pressure has decreased again this quarter.
- Inflation in the period since the last monetary policy assessment has again been lower than expected as it decreased from 1.1% in August to 0.7% in November; both goods and services contributed to this decline.
- In the shorter term, the new conditional inflation forecast is below that of September: 1.1% for 2024, 0.3% for 2025 and 0.8% for 2026, based on the assumption that the SNB policy rate is 0.5% over the entire forecast horizon.
- GDP growth in Switzerland was only modest in the third quarter of 2024 with growth in the services sector again somewhat stronger, while value added in manufacturing declined.
- There was a further slight increase in unemployment, and employment growth was subdued while the utilisation of overall production capacity was normal.
- The SNB anticipates GDP growth of around 1% this year while currently expecting growth of between 1.0% and 1.5% for 2025.
- The SNB will continue to monitor the situation closely and will adjust its monetary policy if necessary to ensure inflation remains within the range consistent with price stability over the medium term.
- The next meeting is on 20 March 2025.
Next 24 Hours Bias
Medium Bearish
The Pound (GBP)
Key news events today
No major news events.
What can we expect from GBP today?
Demand for the pound has picked up strongly since mid-January with Cable soaring nearly 6.5% – it climbed above 1.2900 last week before closing at 1.2921 on Friday. This currency pair resumed its upward momentum as it climbed toward 1.3000 as Asian markets came online.
Central Bank Notes:
- The Bank of England’s Monetary Policy Committee (MPC) voted by a majority of 7 to 2 to reduce the Bank Rate by 25 basis points (bps) to bring it down to 4.50% on 6 February 2025, while two members preferred to reduce it by 50 bps.
- The MPC also voted unanimously to reduce the stock of UK government bond purchases held for monetary policy purposes and financed by the issuance of central bank reserves, by £100B over the next 12 months to a total of £558B, starting in October 2024. On 18 December 2024, the stock of UK government bonds held for monetary policy purposes was £655B.
- CPI inflation was 2.5% in 2024 Q4 as domestic inflationary pressures moderated but remained somewhat elevated while some indicators eased more slowly than expected. Higher global energy costs and regulated price changes are expected to push up headline CPI inflation to 3.7% in 2025 Q3, even as underlying domestic inflationary pressures are expected to wane further.
- While CPI inflation is expected to fall back to around the 2% target thereafter, the Committee will pay close attention to any consequent signs of more lasting inflationary pressures.
- GDP growth has been weaker than expected at the time of the November Monetary Policy Report, and indicators of business and consumer confidence have declined – GDP growth is expected to pick up from the middle of this year.
- The labour market has continued to ease and is judged to be broadly in balance. Productivity growth has been weaker than previously estimated, and the Committee judges that growth in the supply capacity of the economy has weakened.
- Based on the Committee’s evolving view of the medium-term outlook for inflation, a gradual and careful approach to the further withdrawal of monetary policy restraint is appropriate and it will continue to monitor closely the risks of inflation persistence and what the evolving evidence may reveal about the balance between aggregate supply and demand in the economy.
- Monetary policy will need to continue to remain restrictive for sufficiently long until the risks to inflation returning sustainably to the 2% target in the medium term have dissipated further and the Committee will decide the appropriate degree of monetary policy restrictiveness at each meeting.
- The next meeting is on 8 May 2025.
Next 24 Hours Bias
Medium Bullish
The Canadian Dollar (CAD)
Key news events today
No major news events.
What can we expect from CAD today?
The ongoing trade tariffs between the U.S. and Canada have raised uncertainty and volatility for the Loonie, causing USD/CAD to swing wildly between 1.4800 and 1.4150 in recent weeks. After closing at 1.4371 on Friday, this currency pair opened at 1.4378 before edging lower toward 1.4350 at the beginning of the Asia session.
Central Bank Notes:
- The Bank of Canada reduced its target for the overnight rate by 25 basis points bringing it down to 3% on 29 January; this marked the sixth consecutive meeting where rates were reduced.
- The bank announced its plan to complete the normalization of its balance sheet, ending quantitative tightening, and will restart asset purchases in early March, beginning gradually so that its balance sheet stabilizes and then grows modestly, in line with growth in the economy.
- Past cuts to interest rates have started to boost the economy and the recent strengthening in both consumption and housing activity is expected to continue. However, business investment remains weak while the outlook for exports is being supported by new export capacity for oil and gas.
- The Bank forecasts GDP growth will strengthen in 2025 and now projects GDP will grow by 1.8% in both 2025 and 2026, somewhat higher than potential growth.
- The labour market remains soft, with the unemployment rate at 6.7% in December. Job growth has strengthened in recent months, after lagging growth in the labour force for more than a year. Wage pressures, which have proven sticky, are showing some signs of easing.
- CPI inflation remains close to 2%, with some volatility due to the temporary suspension of the GST/HST on some consumer products. Shelter price inflation is still elevated but it is easing gradually, as expected.
- A broad range of indicators, including surveys of inflation expectations and the distribution of price changes among components of the CPI, suggests that underlying inflation is close to 2% with forecasts that CPI inflation will be around the 2% target over the next two years.
- With inflation around 2%, the economy in excess supply, and recent indicators tilted towards softer growth than projected, the Governing Council decided to reduce the policy rate a further 25 basis points to support growth and keep inflation close to the middle of the 1-3% target range.
- The cumulative reduction in the policy rate since last June is substantial as lower interest rates are boosting household spending and the economy is expected to strengthen gradually and inflation to stay close to target. However, if broad-based and significant tariffs were imposed, the resilience of Canada’s economy would be tested.
- The Bank is committed to maintaining price stability for Canadians by keeping inflation close to the 2% target.
- The next meeting is on 12 March 2025.
Next 24 Hours Bias
Medium Bearish
Oil
Key news events today
No major news events.
What can we expect from Oil today?
Coupled with tariff uncertainty and plans by OPEC+ to increase production, oil prices fell sharply with WTI oil losing over 4% as it tumbled toward the $67-mark last week. Prices have now fallen for seven straight weeks, the longest streak since October through December of 2023. This benchmark opened at $67.11 per barrel and then proceeded to fall lower as it dipped under $67.
Next 24 Hours Bias
Medium Bearish
The post IC Markets Europe Fundamental Forecast | 10 March 2025 first appeared on IC Markets | Official Blog.
Monday 10th March 2025: Technical Outlook and Review
413223 March 10, 2025 11:14 ICMarkets Market News
DXY (US Dollar Index):
Potential Direction: Bearish
Overall momentum of the chart: Bearish
Price could potentially make a bearish continuation toward the 1st support
Pivot: 104.42
Supporting reasons: Identified as a pullback resistance, indicating a potential area where selling pressure could intensify.
1st support: 102.65
Supporting reasons: Identified as a pullback support that aligns with a confluence of Fibonacci levels i.e. the 78.6% retracement and the 161.8% extension, indicating a potential area where the price could stabilize once again.
1st resistance: 105.69
Supporting reasons: Identified as a pullback resistance, indicating a potential level that could cap further upward movement.
EUR/USD:
Potential Direction: Bullish
Overall momentum of the chart: Bullish
Price could potentially make a bullish continuation toward the 1st resistance.
Pivot: 1.0777
Supporting reasons: Identified as a pullback support, indicating a potential area where buying interests could pick up to resume the uptrend.
1st support: 1.0600
Supporting reasons: Identified as a pullback support, indicating a potential area where the price could stabilize once more.
1st resistance: 1.1003
Supporting reasons: Identified as a pullback resistance that aligns with the 78.6% Fibonacci retracement, indicating a potential area that could halt any further upward movement.
EUR/JPY:
Potential Direction: Bearish
Overall momentum of the chart: Bearish
Price could potentially make bearish reversal off the pivot and fall toward the 1st support.
Pivot: 160.02
Supporting reasons: Identified as an overlap resistance that aligns close to the 61.8% Fibonacci retracement, indicating a potential area where selling pressures could intensify.
1st support: 155.45
Supporting reasons: Identified as a multi swing low support, indicating a potential area where the price could stabilize once again.
1st resistance: 168.16
Supporting reasons: Identified as a pullback resistance that aligns close to the 61.8% Fibonacci retracement, indicating a potential area that could halt any further upward movement.
EUR/GBP:
Potential Direction: Bullish
Overall momentum of the chart: Bullish
Price could potentially make a bullish continuation toward the 1st resistance.
Pivot: 0.8358
Supporting reasons: Identified as a pullback support, indicating a potential area where buying interests could pick up to resume the uptrend.
1st support: 0.8251
Supporting reasons: Identified as a swing low support, indicating a potential area where the price could stabilize once more.
1st resistance: 0.8465
Supporting reasons: Identified as a multi swing high resistance that aligns with the 61.8% Fibonacci retracement, indicating a potential level that could cap further upward movement.
GBP/USD:
Potential Direction: Bullish
Overall momentum of the chart: Bullish
Price could potentially make a bullish continuation toward the 1st resistance.
Pivot: 1.2774
Supporting reasons: Identified as a pullback support, indicating a potential area where buying interests could pick up to resume the uptrend.
1st support: 1.2511
Supporting reasons: Identified as a pullback support, acting as a potential level where the price could stabilize once again.
1st resistance: 1.3043
Supporting reasons: Identified as an overlap resistance that aligns close to the 127.2% Fibonacci extension, indicating a potential level that could cap further upward movement.
GBP/JPY:
Potential Direction: Bearish
Overall momentum of the chart: Bearish
Price could potentially make a short-term rise toward the pivot before reversing and falling toward the 1st support.
Pivot: 194.64
Supporting reasons: Identified as an overlap resistance that aligns with the 61.8% Fibonacci retracement, indicating a potential area where selling pressures could intensify.
1st support: 187.09
Supporting reasons: Identified as a swing support, indicating a potential level where the price could stabilize once more.
1st resistance: 198.37
Supporting reasons: Identified as a swing-high resistance, indicating a potential level that could cap further upward movement.
USD/CHF:
Potential Direction: Bullish
Overall momentum of the chart: Bearish
could potentially drop further to the pivot in the short term before bouncing from there and rising to the 1st resistance.
Pivot: 0.8727
Supporting reasons: Identified as a pullback support that aligns with the 61.8% Fibonacci retracement, indicating a potential area where price could rebound
1st support: 0.8548
Supporting reasons: Identified as an overlap support that aligns with the 78.6% Fibonacci retracement, indicating a potential level where the price could stabilize once again.
1st resistance: 0.8903
Supporting reasons: Identified as a pullback resistance, indicating a potential level that could cap further upward movement.
USD/JPY:
Potential Direction: Bullish
Overall momentum of the chart: Bearish
could potentially drop further to the pivot in the short term before bouncing from there and rising to the 1st resistance.
Pivot: 146.90
Supporting reasons: Identified as a pullback support that aligns with the 61.8% Fibonacci retracement, indicating a potential area where price could rebound
1st support: 144.74
Supporting reasons: Identified as a pullback support that aligns with the 1008% Fibonacci projection, suggesting a potential area where the price could stabilize once more.
1st resistance: 150.89
Supporting reasons: Identified as an overlap resistance, indicating a potential level that could cap further upward movement.
USD/CAD:
Potential Direction: Bullish
Overall momentum of the chart: Bearish
Price could fall towards the pivot and potentially make a bullish bounce off this level to rise towards the 1st resistance.
Pivot: 1.4151
Supporting reasons: Identified as a swing-low support that aligns close to a confluence of Fibonacci levels i.e. a 50% retracement and a 61.8% projection, indicating a potential area where buying interests could pick up to stage a rebound.
1st support: 1.3946
Supporting reasons: Identified as an overlap support that aligns close to a confluence of Fibonacci levels i.e. a 61.8% retracement, a 100% projection and a 161.8% extension, indicating a key level where the price could stabilize once more.
1st resistance: 1.4477
Supporting reasons: Identified as a swing-high resistance that aligns with a 50% Fibonacci retracement, indicating a potential area that could halt any further upward movement.
AUD/USD:
Potential Direction: Bearish
Overall momentum of the chart: Bearish
Price could rise toward the pivot and potentially make a bearish reversal off this level to fall towards the 1st support.
Pivot: 0.6335
Supporting reasons: Identified as a swing-high resistance that aligns close to a 78.6% Fibonacci retracement, indicating a potential area where selling pressures could intensify. The presence of the red Ichimoku Cloud adds further significance to the strength of the bearish momentum.
1st support: 0.6203
Supporting reasons: Identified as a swing-low support, suggesting a potential area where the price could stabilize once again.
1st resistance: 0.6401
Supporting reasons: Identified as a swing-high resistance, indicating a potential area that could halt any further upward movement.
NZD/USD
Potential Direction: Bearish
Overall momentum of the chart: Bearish
Price could rise toward the pivot and potentially make a bearish reversal off this level to fall towards the 1st support.
Pivot: 0.5761
Supporting reasons: Identified as a multi-swing-high resistance, indicating a potential area where selling pressures could intensify. The presence of the red Ichimoku Cloud adds further significance to the strength of the bearish momentum.
1st support: 0.5595
Supporting reasons: Identified as a swing-low support, suggesting a potential area where the price could stabilize once more.
1st resistance: 0.5828
Supporting reasons: Identified as a pullback resistance that aligns close to a 38.2% Fibonacci retracement, indicating a potential area that could halt any further upward movement.
US30 (DJIA):
Potential Direction: Bullish
Overall momentum of the chart: Bearish
Price could fall towards the pivot and potentially make a bullish bounce off this level to rise towards the 1st resistance.
Pivot: 41,777.16
Supporting reasons: Identified as a multi-swing-low support that aligns close to a confluence of Fibonacci levels i.e. a 50% retracement and a 100% projection, indicating a potential area where buying interests could pick up to stage a rebound.
1st support: 40,202.56
Supporting reasons: Identified as a swing-low support, indicating a potential level where the price could stabilize once again.
1st resistance: 43,339.19
Supporting reasons: Identified as an overlap resistance that aligns close to a 38.2% Fibonacci retracement, indicating a potential area that could halt any further upward movement.
DE40 (DAX):
Potential Direction: Bearish
Overall momentum of the chart: Bullish
Price could rise towards the pivot and could potentially make a bearish reversal off this level to pull back towards the 1st support.
Pivot: 24,159.84
Supporting reasons: Identified as a resistance level that aligns with a 61.8% Fibonacci projection, indicating a potential area where selling pressures could intensify.
1st support: 22,177.80
Supporting reasons: Identified as a swing-low support that aligns close to a 23.6% Fibonacci retracement, indicating a key level where the price could stabilize once more.
1st resistance: 24,707.47
Supporting reasons: Identified as a resistance level that aligns with a 78.6% Fibonacci projection, indicating a potential area that could halt any further upward movement.
US500 (S&P 500):
Potential Direction: Bullish
Overall momentum of the chart: Bearish
Price could fall towards the pivot and potentially make a bullish bounce off this level to rise towards the 1st resistance.
Pivot: 5,669.89
Supporting reasons: Identified as an overlap support that aligns with a 61.8% Fibonacci retracement, indicating a potential area where buying interests could pick up to stage a rebound.
1st support: 5,386.80
Supporting reasons: Identified as a swing-low support, indicating a potential level where the price could stabilize once again.
1st resistance: 5,872.60
Supporting reasons: Identified as an overlap resistance that aligns close to a 38.2% Fibonacci retracement, indicating a potential area that could halt any further upward movement.
BTC/USD (Bitcoin):
Potential Direction: Bullish
Overall momentum of the chart: Bearish
Price is trading close to the pivot and could potentially make a bullish bounce off this level to rise towards the 1st resistance.
Pivot: 82,087.58
Supporting reasons: Identified as a multi-swing-low support that aligns close to a 50% Fibonacci retracement, indicating a potential area where buying interests could pick up to stage a rebound.
1st support: 73,176.19
Supporting reasons: Identified as a pullback support that aligns close to a confluence of Fibonacci levels i.e. a 61.8% retracement and a 127.2% extension, indicating a potential level where the price could stabilize once more.
1st resistance: 94,689.34
Supporting reasons: Identified as an overlap resistance that aligns with a 50% Fibonacci retracement, indicating a potential area that could halt any further upward movement. The presence of a descending trendline and the red Ichimoku Cloud add further significance to the strength of this resistance zone.
ETH/USD (Ethereum):
Potential Direction: Bullish
Overall momentum of the chart: Bearish
Price is trading close to the pivot and could potentially make a bullish bounce off this level to rise towards the 1st resistance.
Pivot: 2,044.47
Supporting reasons: Identified as a multi-swing-low support, indicating a potential area where buying interests could pick up to stage a rebound.
1st support: 1,511.83
Supporting reasons: Identified as a multi-swing-low support that aligns close to a 127.2% Fibonacci extension, indicating a potential level where the price could stabilize once again.
1st resistance: 2,540.00
Supporting reasons: Identified as an overlap resistance that aligns close to a 38.2% Fibonacci retracement, indicating a potential area that could halt any further upward movement. The presence of a descending trendline and the red Ichimoku Cloud add further significance to the strength of this resistance zone.
WTI/USD (Oil):
Potential Direction: Bearish
Overall momentum of the chart: Bearish
Price could rise towards the pivot and potentially make a bearish reversal off this level to fall towards the 1st support.
Pivot: 68.85
Supporting reasons: Identified as an overlap resistance that aligns with a 23.6 Fibonacci retracement, indicating a potential area where selling pressures could intensify. The presence of the red Ichimoku Cloud adds further significance to the strength of the bearish momentum.
1st support: 65.64
Supporting reasons: Identified as a multi-swing-low support, indicating a key level where the price could stabilize once more.
1st resistance: 72.58
Supporting reasons: Identified as a swing-high resistance that aligns close to a 50% Fibonacci retracement, indicating a potential area that could halt any further upward movement.
XAU/USD (GOLD):
Potential Direction: Bearish
Overall momentum of the chart: Bullish
Price has made a bearish reversal off the pivot and could potentially fall towards the 1st support.
Pivot: 2927.67
Supporting reasons: Identified as an overlap resistance, indicating a potential area where selling pressure could intensify.
1st support: 2790
Supporting reasons: Identified as an overlap support that aligns close to the 50% Fibonacci retracement, acting as a potential level where price could stabilize once again.
1st resistance: 2985.55
Supporting reasons: Identified as a resistance that aligns with the 127.2% Fibonacci extension, indicating a potential area that could halt any further upward movement.
The accuracy, completeness and timeliness of the information contained on this site cannot be guaranteed. IC Markets does not warranty, guarantee or make any representations, or assume any liability regarding financial results based on the use of the information in the site.
News, views, opinions, recommendations and other information obtained from sources outside of www.icmarkets.com, used in this site are believed to be reliable, but we cannot guarantee their accuracy or completeness. All such information is subject to change at any time without notice. IC Markets assumes no responsibility for the content of any linked site.
The fact that such links may exist does not indicate approval or endorsement of any material contained on any linked site. IC Markets is not liable for any harm caused by the transmission, through accessing the services or information on this site, of a computer virus, or other computer code or programming device that might be used to access, delete, damage, disable, disrupt or otherwise impede in any manner, the operation of the site or of any user’s software, hardware, data or property.
The post Monday 10th March 2025: Technical Outlook and Review first appeared on IC Markets | Official Blog.
IC Markets Asia Fundamental Forecast | 10 March 2025
413222 March 10, 2025 11:14 ICMarkets Market News
IC Markets Asia Fundamental Forecast | 10 March 2025
What happened in the U.S. session?
The U.S. economy added 151k jobs in February, missing market forecasts of 160k, while January’s figures were revised lower from 143k to 125k as per the Bureau of Labor Statistics (BLS). Sectors such as health care; financial activities; transportation and warehousing; and social assistance were the main drivers of job growth. Meanwhile, the unemployment rate edged higher to from 4.0 to 4.1%, exceeding the estimate of 4.0%, as federal government employment declined by 10k, reflecting some of the impact of the DOGE layoffs. The dollar index (DXY) initially weakened as the combination of softer non-farm payrolls (NFPs) and an uptick in unemployment fuelled speculation that the Federal Reserve would reduce interest rates at the upcoming FOMC meeting from 18th to 19th March, following a pause in January. Gold rallied post-report with spot prices hitting $2,930/oz – this precious metal rebounded 1.6% after falling 2.7% in the prior week.
What does it mean for the Asia Session?
As Asian markets digest the latest NFP figures, the DXY resumed its downward trend as it slid toward 103.50 while spot prices for gold remained elevated, floating around $2,910/oz. With no major data releases scheduled for Monday, it could be a relatively quiet day as the brand-new trading week gets underway.
The Dollar Index (DXY)
Key news events today
NY Fed Consumer Inflation Expectations (3:00 pm GMT)
What can we expect from DXY today?
Consumer inflation expectations for the year ahead remained at 3.0% for a third consecutive month in January as price expectations rose across for gas; food; medical care; college; and rent. In addition, median home price growth expectations also rose as mortgage rates declined over this period. Inflation expectations could increase in February as the recent consumer confidence survey highlighted a surge from 5.2% to 6.0%, a result that could lift the greenback.
Central Bank Notes:
- The Board of Governors of the Federal Reserve System voted unanimously to maintain the Federal Funds Rate in a target range of 4.25 to 4.50% on 29 January.
- The Committee seeks to achieve maximum employment and inflation at the rate of 2% over the longer run and judges that the risks to achieving its employment and inflation goals are roughly in balance. The economic outlook is uncertain, and the Committee is attentive to the risks to both sides of its dual mandate.
- Recent indicators suggest that economic activity has continued to expand at a solid pace while the unemployment rate has stabilized at a low level in recent months, and labour market conditions remain solid. However, inflation remains somewhat elevated.
- December’s Summary of Economic Projections (SEP) now indicates just two rate cuts in 2025 totalling 50 bps, compared to the full percentage point of reductions projected in the previous quarter.
- GDP growth forecasts were revised upward for 2024 (2.5% vs. 2% in the September projection) and 2025 (2.1% vs. 2%), while remaining steady at 2% for 2026. Similarly, PCE inflation projections have been adjusted higher for 2024 (2.4% vs. 2.3%), 2025 (2.5% vs. 2.1%), and 2026 (2.1% vs. 2%).
- In assessing the appropriate stance of monetary policy, the Committee will continue to monitor the implications of incoming information for the economic outlook and would be prepared to adjust the stance of monetary policy as appropriate if risks emerge that could impede the attainment of the Committee’s goals.
- The Committee will roll over at auction the amount of principal payments from the Federal Reserve’s holdings of Treasury securities maturing in each calendar month that exceeds a cap of $25 billion per month and redeem Treasury coupon securities up to this monthly cap and Treasury bills to the extent that coupon principal payments are less than the monthly cap.
- In addition, the Committee will reinvest the amount of principal payments from the Federal Reserve’s holdings of agency debt and agency mortgage-backed securities (MBS) received in each calendar month that exceeds a cap of $35 billion per month into Treasury securities to roughly match the maturity composition of Treasury securities outstanding.
- The next meeting runs from 18 to 19 March 2025.
Next 24 Hours Bias
Medium Bearish
Gold (XAU)
Key news events today
NY Fed Consumer Inflation Expectations (3:00 pm GMT)
What can we expect from Gold today?
Consumer inflation expectations for the year ahead remained at 3.0% for a third consecutive month in January as price expectations rose across for gas; food; medical care; college; and rent. In addition, median home price growth expectations also rose as mortgage rates declined over this period. Inflation expectations could increase in February as the recent consumer confidence survey highlighted a surge from 5.2% to 6.0%, a result that could continue to keep gold prices elevated.
Next 24 Hours Bias
Medium Bullish
The Australian Dollar (AUD)
Key news events today
No major news events.
What can we expect from AUD today?
After tumbling 2.3% in the prior week, the Aussie rebounded 1.5% as it rallied above 0.6300. After closing at 0.6304 last Friday, this currency pair was rising steadily toward 0.6350 and it is likely to remain elevated.
Central Bank Notes:
- The RBA reduced the cash rate by 25 basis points to bring it down to 4.10% on 18 February, marking the first rate cut since November 2020.
- Financial conditions are restrictive, which is weighing on demand and is helping to bring down underlying inflation; growth in private demand has been subdued.
- Underlying inflation has moderated over the past three quarters with trimmed mean inflation easing to 3.2% over 2024 and it is expected to reach the 2–3% target range in early 2025, which is sooner than expected at the time of the November Statement.
- The unemployment rate declined a little in late 2024 to 4% with much of the strength in the labour market underpinned by strong employment growth, which has also bolstered household incomes.
- The announcement of tariffs between the United States and other major economies poses challenges to the global outlook but the scale and incidence of the tariffs and their effects remain highly uncertain – which may itself delay some investment until the outlook becomes clearer.
- Economic activity strengthened in China but growth there is still facing structural headwinds while domestic economic growth is forecast to pick up and the labour market is forecast to remain tight.
- If the cash rate follows the market path, underlying inflation is projected to be a little above 2.5% over most of the forecast period. The anticipated recovery of GDP growth and lingering tightness in labour market conditions are expected to sustain some upward pressure on inflation.
- Sustainably returning inflation to target within a reasonable timeframe remains the Board’s highest priority. This is consistent with the RBA’s mandate for price stability and full employment.
- The Board will continue to rely upon the data and the evolving assessment of risks to guide its decisions, paying close attention to developments in the global economy and financial markets, trends in domestic demand, and the outlook for inflation and the labour market.
- The next meeting is on 1 April 2025.
Next 24 Hours Bias
Medium Bullish
The Kiwi Dollar (NZD)
Key news events today
No major news events.
What can we expect from NZD today?
The Kiwi rallied nearly 2% last week as it soared above 0.5750 before closing at 0.5707 on Friday. This currency pair edged higher towards 0.5750 after markets re-opened today.
Central Bank Notes:
- The Monetary Policy Committee (MPC) agreed to reduce the Official Cash Rate (OCR) by 50 basis points bringing it down to 3.75% on 19 February, marking the fourth consecutive rate cut.
- The Committee assessed that annual consumer price inflation remains near the midpoint of the MPC’s 1 to 3% target band; inflation expectations are at target and core inflation continues to fall towards the target mid-point.
- Economic activity in New Zealand remains subdued and with spare productive capacity, domestic inflation pressures continue to ease. Price and wage-setting behaviours are adapting to a low-inflation environment while the price of imports has fallen, also contributing to lower headline inflation.
- Economic growth is expected to recover during 2025 as lower interest rates will encourage spending, although elevated global economic uncertainty is expected to weigh on business investment decisions. Higher prices for some key commodities and a lower exchange rate will increase export revenues and employment growth is expected to pick up in the second half of the year as the domestic economy recovers.
- Global economic growth is expected to remain subdued in the near term as geopolitics, including uncertainty about trade barriers, is likely to weaken global growth. Global economic activity is also likely to remain fragile over the medium term given increasing geoeconomic fragmentation.
- Consumer price inflation is expected to be volatile in the near term, due to a lower exchange rate and higher petrol prices. Nevertheless, the Committee is well placed to maintain price stability over the medium term.
- The economic outlook remains consistent with inflation remaining in the band over the medium term, giving the Committee confidence to continue lowering the OCR. If economic conditions continue to evolve as projected, the Committee has scope to lower the OCR further through 2025.
- The next meeting is on 9 April 2025.
Next 24 Hours Bias
Medium Bullish
The Japanese Yen (JPY)
Key news events today
No major news events.
What can we expect from JPY today?
The yen saw strong inflows as it appreciated strongly versus the greenback. Demand for safe-haven currencies such as the yen amidst the backdrop of global trade uncertainties drove USD/JPY under 147 last week before closing at 148.02 last Friday. This currency pair drifted lower toward 147 once more at the beginning of the Asia session.
Central Bank Notes:
- The Policy Board of the Bank of Japan decided on 24 January, by an 8-1 majority vote, to set the following guidelines for money market operations for the inter-meeting period:
- The Bank will encourage the uncollateralized overnight call rate to remain at around 0.5%.
- The Bank will embark on a plan to reduce the amount of its monthly outright purchases of JGBs so that it will be about 3 trillion yen in January-March 2026; the amount will be cut down by about 400 billion yen each calendar quarter in principle.
- Japan’s economy has recovered moderately, although some weakness has been seen in part. Exports and industrial production have been more or less flat while corporate profits have been on an improving trend and business sentiment has stayed at a favourable level.
- The employment and income situation has improved moderately while private consumption has been on a moderately increasing trend despite the impact of price rises and other factors.
- On the price front, the year-on-year rate of increase in the consumer price index (CPI, all items less fresh food) has been at around 3% recently, as services prices have continued to rise moderately, reflecting factors such as wage increases, although the effects of a pass-through to consumer prices of cost increases led by the past rise in import prices have waned.
- Inflation expectations have risen moderately while underlying CPI inflation has been increasing gradually toward the price stability target of 2%. With wages continuing to rise, there has been an increase in moves to reflect higher costs, such as increased personnel expenses and distribution costs, in selling prices.
- Japan’s economy is likely to keep growing at a pace above its potential growth rate, with overseas economies continuing to grow moderately and as a virtuous cycle from income to spending gradually intensifies against the background of factors such as accommodative financial conditions.
- The next meeting is on 19 March 2025.
Next 24 Hours Bias
Medium Bearish
The Euro (EUR)
Key news events today
Germany Industrial Production (7:00 am GMT)
What can we expect from EUR today?
Industrial production in Germany declined by 2.4% in December, dragged down by the automotive industry; and machine maintenance and assembly. Not only did output fall more than the forecast of a 0.6% drop, but it also marked the steepest decrease since July. However, January’s estimate points to a relatively strong rebound of 1.6% – a result that could boost the Euro before the start of the European trading hours.
Central Bank Notes:
- The Governing Council reduced the three key ECB interest rates by 25 basis points on 6 March to mark the fifth successive rate cut.
- Accordingly, the interest rate on the main refinancing operations and the interest rates on the marginal lending facility and the deposit facility will be decreased to 2.65%, 2.90% and 2.50% respectively.
- The Council acknowledged that monetary policy was becoming meaningfully less restrictive, easing borrowing costs for businesses and households with inflation projected to average 2.3% in 2025, 1.9% in 2026, and 2.0% in 2027, while core inflation also neared the 2% target.
- Although domestic inflation remains elevated due to delayed wage and price adjustments, wage growth is moderating.
- Economic growth forecasts were revised downward to 0.9% for 2025 and 1.2% for 2026, reflecting weak exports and investment.
- The asset purchase programme (APP) and pandemic emergency purchase programme (PEPP) portfolios are declining at a measured and predictable pace, as the Eurosystem no longer reinvests the principal payments from maturing securities.
- The ECB remains data-dependent and will adjust its policy as needed to ensure inflation stabilizes around its 2% medium-term target without committing to a specific rate path.
- The next meeting is on 17 April 2025.
Next 24 Hours Bias
Medium Bullish
The Swiss Franc (CHF)
Key news events today
No major news events.
What can we expect from CHF today?
Demand for safe-haven currencies such as the franc amidst the backdrop of global trade uncertainties caused USD/CHF to dive under 0.8800 last week. This currency pair slid toward 0.8750 as Asian markets came online.
Central Bank Notes:
- The SNB eased monetary policy by lowering its key policy rate by 50 basis points, going from 1.00% to 0.50% on 12 December, marking the fourth consecutive reduction.
- Underlying inflationary pressure has decreased again this quarter.
- Inflation in the period since the last monetary policy assessment has again been lower than expected as it decreased from 1.1% in August to 0.7% in November; both goods and services contributed to this decline.
- In the shorter term, the new conditional inflation forecast is below that of September: 1.1% for 2024, 0.3% for 2025 and 0.8% for 2026, based on the assumption that the SNB policy rate is 0.5% over the entire forecast horizon.
- GDP growth in Switzerland was only modest in the third quarter of 2024 with growth in the services sector again somewhat stronger, while value added in manufacturing declined.
- There was a further slight increase in unemployment, and employment growth was subdued while the utilisation of overall production capacity was normal.
- The SNB anticipates GDP growth of around 1% this year while currently expecting growth of between 1.0% and 1.5% for 2025.
- The SNB will continue to monitor the situation closely and will adjust its monetary policy if necessary to ensure inflation remains within the range consistent with price stability over the medium term.
- The next meeting is on 20 March 2025.
Next 24 Hours Bias
Medium Bearish
The Pound (GBP)
Key news events today
No major news events.
What can we expect from GBP today?
Demand for the pound has picked up strongly since mid-January with Cable soaring nearly 6.5% – it climbed above 1.2900 last week before closing at 1.2921 on Friday. This currency pair resumed its upward momentum as it climbed toward 1.3000 as Asian markets came online.
Central Bank Notes:
- The Bank of England’s Monetary Policy Committee (MPC) voted by a majority of 7 to 2 to reduce the Bank Rate by 25 basis points (bps) to bring it down to 4.50% on 6 February 2025, while two members preferred to reduce it by 50 bps.
- The MPC also voted unanimously to reduce the stock of UK government bond purchases held for monetary policy purposes and financed by the issuance of central bank reserves, by £100B over the next 12 months to a total of £558B, starting in October 2024. On 18 December 2024, the stock of UK government bonds held for monetary policy purposes was £655B.
- CPI inflation was 2.5% in 2024 Q4 as domestic inflationary pressures moderated but remained somewhat elevated while some indicators eased more slowly than expected. Higher global energy costs and regulated price changes are expected to push up headline CPI inflation to 3.7% in 2025 Q3, even as underlying domestic inflationary pressures are expected to wane further.
- While CPI inflation is expected to fall back to around the 2% target thereafter, the Committee will pay close attention to any consequent signs of more lasting inflationary pressures.
- GDP growth has been weaker than expected at the time of the November Monetary Policy Report, and indicators of business and consumer confidence have declined – GDP growth is expected to pick up from the middle of this year.
- The labour market has continued to ease and is judged to be broadly in balance. Productivity growth has been weaker than previously estimated, and the Committee judges that growth in the supply capacity of the economy has weakened.
- Based on the Committee’s evolving view of the medium-term outlook for inflation, a gradual and careful approach to the further withdrawal of monetary policy restraint is appropriate and it will continue to monitor closely the risks of inflation persistence and what the evolving evidence may reveal about the balance between aggregate supply and demand in the economy.
- Monetary policy will need to continue to remain restrictive for sufficiently long until the risks to inflation returning sustainably to the 2% target in the medium term have dissipated further and the Committee will decide the appropriate degree of monetary policy restrictiveness at each meeting.
- The next meeting is on 8 May 2025.
Next 24 Hours Bias
Medium Bullish
The Canadian Dollar (CAD)
Key news events today
No major news events.
What can we expect from CAD today?
The ongoing trade tariffs between the U.S. and Canada have raised uncertainty and volatility for the Loonie, causing USD/CAD to swing wildly between 1.4800 and 1.4150 in recent weeks. After closing at 1.4371 on Friday, this currency pair opened at 1.4378 before edging lower toward 1.4350 at the beginning of the Asia session.
Central Bank Notes:
- The Bank of Canada reduced its target for the overnight rate by 25 basis points bringing it down to 3% on 29 January; this marked the sixth consecutive meeting where rates were reduced.
- The bank announced its plan to complete the normalization of its balance sheet, ending quantitative tightening, and will restart asset purchases in early March, beginning gradually so that its balance sheet stabilizes and then grows modestly, in line with growth in the economy.
- Past cuts to interest rates have started to boost the economy and the recent strengthening in both consumption and housing activity is expected to continue. However, business investment remains weak while the outlook for exports is being supported by new export capacity for oil and gas.
- The Bank forecasts GDP growth will strengthen in 2025 and now projects GDP will grow by 1.8% in both 2025 and 2026, somewhat higher than potential growth.
- The labour market remains soft, with the unemployment rate at 6.7% in December. Job growth has strengthened in recent months, after lagging growth in the labour force for more than a year. Wage pressures, which have proven sticky, are showing some signs of easing.
- CPI inflation remains close to 2%, with some volatility due to the temporary suspension of the GST/HST on some consumer products. Shelter price inflation is still elevated but it is easing gradually, as expected.
- A broad range of indicators, including surveys of inflation expectations and the distribution of price changes among components of the CPI, suggests that underlying inflation is close to 2% with forecasts that CPI inflation will be around the 2% target over the next two years.
- With inflation around 2%, the economy in excess supply, and recent indicators tilted towards softer growth than projected, the Governing Council decided to reduce the policy rate a further 25 basis points to support growth and keep inflation close to the middle of the 1-3% target range.
- The cumulative reduction in the policy rate since last June is substantial as lower interest rates are boosting household spending and the economy is expected to strengthen gradually and inflation to stay close to target. However, if broad-based and significant tariffs were imposed, the resilience of Canada’s economy would be tested.
- The Bank is committed to maintaining price stability for Canadians by keeping inflation close to the 2% target.
- The next meeting is on 12 March 2025.
Next 24 Hours Bias
Medium Bearish
Oil
Key news events today
No major news events.
What can we expect from Oil today?
Coupled with tariff uncertainty and plans by OPEC+ to increase production, oil prices fell sharply with WTI oil losing over 4% as it tumbled toward the $67-mark last week. Prices have now fallen for seven straight weeks, the longest streak since October through December of 2023. This benchmark opened at $67.11 per barrel and then proceeded to fall lower as it dipped under $67.
Next 24 Hours Bias
Medium Bearish
The post IC Markets Asia Fundamental Forecast | 10 March 2025 first appeared on IC Markets | Official Blog.
General Market Analysis – 10/03/25
413213 March 10, 2025 07:39 ICMarkets Market News
US Stocks Rally After Non-Farms and Powell – Nasdaq Up 0.70%
The major US indices all closed higher after jobs data came in slightly below expectations, and Jerome Powell stated that the economy is in a ‘good place’. The Dow finished up 0.52%, the S&P rose 0.55%, and the Nasdaq gained 0.70%.
US Treasury yields moved higher, with the 2-year yield rising 3.1 basis points to 3.999%, while the 10-year yield edged up 1.3 basis points to 4.301%. Meanwhile, the dollar continued to weaken, with the DXY down 0.26% to 103.84. Oil prices rebounded from recent lows, with Brent up 0.97% to $70.32 and WTI gaining 1.06% to $67.04. Gold remained relatively stable, trading within a tight range and closing nearly flat at $2,910.76 per ounce.
Gold in a Holding Pattern
Global markets experienced extreme volatility last week, with significant moves across various assets. However, gold remained relatively subdued, trading within much smaller ranges than expected.
Despite the dollar plummeting nearly 4%, gold held firm, staying just above the $2,900 level for most of the week. Given the recent turbulence in the precious metal, this relative calm has surprised some traders. While gold remains within striking distance of all-time highs, expectations for a retest have waned. Instead, some traders anticipate a potential correction if profit-taking increases and the dollar regains favour. What most market participants agree on is that stronger moves are likely in the days and weeks ahead.
A Quiet Calendar Day to Kick Off the Week
This week’s macroeconomic calendar is far quieter than last week’s, with no tier-one data releases scheduled for today. Traders expect rangebound conditions in the early session but will closely monitor newswires for geopolitical developments that could drive market movements.
Despite last week’s packed calendar, the biggest market shifts were driven by geopolitical updates. Many market participants believe this trend will continue, with a strong focus on global trade issues and potential stimulus measures in the coming days.
The post General Market Analysis – 10/03/25 first appeared on IC Markets | Official Blog.
The Week Ahead – Week Commencing 10 March 2025
413203 March 10, 2025 06:00 ICMarkets Market News
It was a hectic trading week in financial markets last week, and traders expect volatility to remain high in the week ahead, despite a lighter macroeconomic event calendar. Key US inflation data, due out in the middle of the week, will be a major focus for investors, as will the Bank of Canada’s latest rate decision. There is a smattering of other data due throughout the week, but most market participants expect geopolitical factors to dominate market movements.
Here is our usual day-by-day breakdown of the major risk events this week:

It is set to be a quiet start to the week, with little on the calendar across all three trading sessions. There is some concern about gapping on the Monday open in Asia after Chinese CPI and PPI data over the weekend came in lower than expected.

Another relatively quiet day, with nothing of note due in the first two trading sessions. However, key US jobs data is scheduled once New York opens, with the JOLTS Job Openings report due for release. This data is typically published in the first week of the month but has been moved this time, so the market impact may be slightly increased.

Wednesday is likely to be the busiest day of the week for markets, with the US session hosting two of the major events. There is nothing of note due in the Asian session, and ECB President Christine Lagarde is scheduled to speak during the European session. However, focus will sharpen once New York opens. First, the key US CPI data is due, which could trigger substantial market moves. This will be swiftly followed by the Bank of Canada’s latest rate decision, rate statement, and subsequent press conference.

The first two sessions on Thursday are expected to be relatively quiet, but the second round of US inflation data is due once New York opens. This time, PPI data will be released alongside the usual weekly Unemployment Claims report. PPI numbers traditionally have a slightly lower impact than the previous day’s CPI data.

The Asian session rounds out a week with little to offer from a calendar perspective. However, UK markets will come into focus at the London open, with key GDP data scheduled for release early in the session. The US session should be quieter heading into the weekend, though the Preliminary University of Michigan Consumer Sentiment and Inflation Expectations figures are due shortly after the open.
The post The Week Ahead – Week Commencing 10 March 2025 first appeared on IC Markets | Official Blog.
Ex-Dividend 10/3/2025
413154 March 7, 2025 17:00 ICMarkets Market News
|
1
|
Ex-Dividends | ||
|---|---|---|---|
|
2
|
10/3/2025 | ||
|
3
|
Indices | Name |
Index Adjustment Points
|
|
4
|
Australia 200 CFD
|
AUS200 | 4.06 |
|
5
|
IBEX-35 Index | ES35 | |
|
6
|
France 40 CFD | F40 | |
|
7
|
Hong Kong 50 CFD
|
HK50 | |
|
8
|
Italy 40 CFD | IT40 | |
|
9
|
Japan 225 CFD
|
JP225 | |
|
10
|
EU Stocks 50 CFD
|
STOXX50 | |
|
11
|
UK 100 CFD | UK100 | |
|
12
|
US SP 500 CFD
|
US500 | 1.02 |
|
13
|
Wall Street CFD
|
US30 | 19.36 |
|
14
|
US Tech 100 CFD
|
USTEC | 1.23 |
|
15
|
FTSE CHINA 50
|
CHINA50 | |
|
16
|
Canada 60 CFD
|
CA60 | 0.35 |
|
17
|
Germany Tech 40 CFD
|
TecDE30 | |
|
18
|
Germany Mid 50 CFD
|
MidDE50 | |
|
19
|
Netherlands 25 CFD
|
NETH25 | |
|
20
|
Switzerland 20 CFD
|
SWI20 | |
|
21
|
Hong Kong China H-shares CFD
|
CHINAH | |
|
22
|
Norway 25 CFD
|
NOR25 | |
|
23
|
South Africa 40 CFD
|
SA40 | |
|
24
|
Sweden 30 CFD
|
SE30 | |
|
25
|
US 2000 CFD | US2000 | 0.25 |
The post Ex-Dividend 10/3/2025 first appeared on IC Markets | Official Blog.
Friday 7th March 2025: Asia-Pacific Markets Slide Amid U.S. Economic Concerns and Weak China Trade Data
413148 March 7, 2025 14:01 ICMarkets Market News
Global Markets:
- Asian Stock Markets : Nikkei up 0.88%, Shanghai Composite up 0.88%, Hang Seng up 2.46% ASX down 0.57%
- Commodities : Gold at $2924.35 (0.09%), Silver at $33.15 (0.08%), Brent Oil at $69.5 (0.35%), WTI Oil at $66.68 (0.4%)
- Rates : US 10-year yield at 4.325, UK 10-year yield at 4.6720, Germany 10-year yield at 2.7830
News & Data:
- (EUR) Main Refinancing Rate 2.65% to 2.65% expected
- (USD) Unemployment Claims 221K to 234K expected
Markets Update:
Asia-Pacific markets declined on Friday as long-term Japanese government bond yields hit their highest levels since the 2008 financial crisis. The drop mirrored Wall Street’s losses after U.S. President Donald Trump’s tariff concessions failed to reassure investors. Concerns over U.S. economic data also weighed on sentiment, with the Federal Reserve’s Beige Book and the Institute for Supply Management’s manufacturing report highlighting fears of rising input costs due to tariffs.
China’s exports for January and February rose 2.3% in U.S. dollar terms from a year earlier, falling short of the 5% growth expected in a Reuters poll. This marked the slowest increase since April last year when exports grew by just 1.5%, according to LSEG data. The disappointing trade figures added to worries about weakening demand and potential economic slowdown.
Japan’s Nikkei 225 led regional losses, dropping 2%, while the Topix fell 1.51%. South Korea’s Kospi declined 0.44%, with the small-cap Kosdaq down 0.43%. Australia’s S&P/ASX 200 slid 1.71%. Meanwhile, Hong Kong’s Hang Seng index edged up 0.56%, while mainland China’s CSI 300 dipped 0.14%. India’s Nifty 50 gained 0.12%, and the BSE Sensex remained flat.
In the U.S., all three major indexes fell overnight. The Nasdaq Composite dropped 2.61%, entering correction territory after falling 10% from a recent high. The Dow Jones Industrial Average slipped 0.99%, while the S&P 500 declined 1.78%, reflecting persistent investor uncertainty.
Upcoming Events:
- 01:30 PM GMT – CAD Employment Change
- 01:30 PM GMT – CAD Unemployment Rate
- 01:30 PM GMT – USD Average Hourly Earnings m/m
- 01:30 PM GMT – USD Non-Farm Employment Change
- 01:30 PM GMT – USD Unemployment Rate
- 05:30 PM GMT – USD Fed Chair Powell Speaks
The post Friday 7th March 2025: Asia-Pacific Markets Slide Amid U.S. Economic Concerns and Weak China Trade Data first appeared on IC Markets | Official Blog.
IC Markets Europe Fundamental Forecast | 7 March 2025
413147 March 7, 2025 14:00 ICMarkets Market News
IC Markets Europe Fundamental Forecast | 7 March 2025
What happened in the Asia session?
Financial markets treaded with caution as the dollar index (DXY) floated around 104 while spot prices for gold drifted towards $2,900/oz. Trading activity could continue to remain relatively muted during the European hours but markets should spring to life once the non-farm payrolls (NFPs) hit the news wires at the beginning of the U.S. session.
What does it mean for the Europe & US sessions?
ECB President Christine Lagarde will be in the spotlight on Friday once more but this time she will be speaking at the International Women’s Day event in Frankfurt where she could be probed with questions on monetary policy action by the ECB. The Euro surged more than 4% at its highest point this week and this currency pair should continue to remain elevated as the trading week comes to a close.
Meanwhile, Canada will also release the equivalent of its NFPs later today and the simultaneous release of their employment figures alongside the BLS’s labour data is bound to inject higher volatility for the Loonie later today.
The Dollar Index (DXY)
Key news events today
BLS Employment Report (1:30 pm GMT)
Fed Chair Powell’s Speech (5:30 pm GMT)
U.S. President Trump’s Speech (6:30 pm GMT)
What can we expect from DXY today?
The highly anticipated NFPs will be released by the BLS where 159k jobs are expected to be added to the U.S. labour market in February while the unemployment rate remains unchanged at 4.0%. However, Wednesday’s ADP highlighted a significant slowdown in job creation for the private sector with only 77k workers added to payrolls, massively undershooting forecasts of 140k. Combined with the recent uncertainty surrounding global trade tariffs, corporates could have adopted a ‘wait and see’ approach with regard to hiring in February, suggesting weaker job growth for tonight’s data.
Later on, Federal Reserve Chairman Jerome Powell will be speaking about the economic outlook at the University of Chicago Booth School of Business US Monetary Policy Forum where audience questions are expected. There is no doubt that Chairman Powell will be peppered with queries on the latest NFP print. In addition, U.S. President Donald Trump will be participating in a roundtable discussion about cryptocurrency policy at the White House in Washington D.C. where this asset class will be looking for another bullish catalyst to bolster market sentiment.
Central Bank Notes:
- The Board of Governors of the Federal Reserve System voted unanimously to maintain the Federal Funds Rate in a target range of 4.25 to 4.50% on 29 January.
- The Committee seeks to achieve maximum employment and inflation at the rate of 2% over the longer run and judges that the risks to achieving its employment and inflation goals are roughly in balance. The economic outlook is uncertain, and the Committee is attentive to the risks to both sides of its dual mandate.
- Recent indicators suggest that economic activity has continued to expand at a solid pace while the unemployment rate has stabilized at a low level in recent months, and labour market conditions remain solid. However, inflation remains somewhat elevated.
- December’s Summary of Economic Projections (SEP) now indicates just two rate cuts in 2025 totalling 50 bps, compared to the full percentage point of reductions projected in the previous quarter.
- GDP growth forecasts were revised upward for 2024 (2.5% vs. 2% in the September projection) and 2025 (2.1% vs. 2%), while remaining steady at 2% for 2026. Similarly, PCE inflation projections have been adjusted higher for 2024 (2.4% vs. 2.3%), 2025 (2.5% vs. 2.1%), and 2026 (2.1% vs. 2%).
- In assessing the appropriate stance of monetary policy, the Committee will continue to monitor the implications of incoming information for the economic outlook and would be prepared to adjust the stance of monetary policy as appropriate if risks emerge that could impede the attainment of the Committee’s goals.
- The Committee will roll over at auction the amount of principal payments from the Federal Reserve’s holdings of Treasury securities maturing in each calendar month that exceeds a cap of $25 billion per month and redeem Treasury coupon securities up to this monthly cap and Treasury bills to the extent that coupon principal payments are less than the monthly cap.
- In addition, the Committee will reinvest the amount of principal payments from the Federal Reserve’s holdings of agency debt and agency mortgage-backed securities (MBS) received in each calendar month that exceeds a cap of $35 billion per month into Treasury securities to roughly match the maturity composition of Treasury securities outstanding.
- The next meeting runs from 18 to 19 March 2025.
Next 24 Hours Bias
Medium Bearish
Gold (XAU)
Key news events today
BLS Employment Report (1:30 pm GMT)
Fed Chair Powell’s Speech (5:30 pm GMT)
What can we expect from Gold today?
The highly anticipated NFPs will be released by the BLS where 159k jobs are expected to be added to the U.S. labour market in February while the unemployment rate remains unchanged at 4.0%. However, Wednesday’s ADP highlighted a significant slowdown in job creation for the private sector with only 77k workers added to payrolls, massively undershooting forecasts of 140k. Combined with the recent uncertainty surrounding global trade tariffs, corporates could have adopted a ‘wait and see’ approach with regard to hiring in February, suggesting weaker job growth for tonight’s data. Later on, Federal Reserve Chairman Jerome Powell will be speaking about the economic outlook at the University of Chicago Booth School of Business US Monetary Policy Forum where audience questions are expected. There is no doubt that Chairman Powell will be peppered with queries on the latest NFP print.
Next 24 Hours Bias
Weak Bearish
The Australian Dollar (AUD)
Key news events today
No major news events.
What can we expect from AUD today?
The Aussie had risen 2.5% this week before running out of steam at around 0.6363 on Thursday. This currency pair eased toward 0.6300 overnight and the downward momentum was gaining traction as Asian markets came online on the final trading day of the week.
Central Bank Notes:
- The RBA reduced the cash rate by 25 basis points to bring it down to 4.10% on 18 February, marking the first rate cut since November 2020.
- Financial conditions are restrictive, which is weighing on demand and is helping to bring down underlying inflation; growth in private demand has been subdued.
- Underlying inflation has moderated over the past three quarters with trimmed mean inflation easing to 3.2% over 2024 and it is expected to reach the 2–3% target range in early 2025, which is sooner than expected at the time of the November Statement.
- The unemployment rate declined a little in late 2024 to 4% with much of the strength in the labour market underpinned by strong employment growth, which has also bolstered household incomes.
- The announcement of tariffs between the United States and other major economies poses challenges to the global outlook but the scale and incidence of the tariffs and their effects remain highly uncertain – which may itself delay some investment until the outlook becomes clearer.
- Economic activity strengthened in China but growth there is still facing structural headwinds while domestic economic growth is forecast to pick up and the labour market is forecast to remain tight.
- If the cash rate follows the market path, underlying inflation is projected to be a little above 2.5% over most of the forecast period. The anticipated recovery of GDP growth and lingering tightness in labour market conditions are expected to sustain some upward pressure on inflation.
- Sustainably returning inflation to target within a reasonable timeframe remains the Board’s highest priority. This is consistent with the RBA’s mandate for price stability and full employment.
- The Board will continue to rely upon the data and the evolving assessment of risks to guide its decisions, paying close attention to developments in the global economy and financial markets, trends in domestic demand, and the outlook for inflation and the labour market.
- The next meeting is on 1 April 2025.
Next 24 Hours Bias
Medium Bullish
The Kiwi Dollar (NZD)
Key news events today
No major news events.
What can we expect from NZD today?
After soaring nearly 3% this week, the Kiwi fizzled out on Thursday as it hit an overnight high of 0.5759. This currency pair was edging lower towards 0.5700 at the beginning of the Asia session as it took a breather after a strong run-up.
Central Bank Notes:
- The Monetary Policy Committee (MPC) agreed to reduce the Official Cash Rate (OCR) by 50 basis points bringing it down to 3.75% on 19 February, marking the fourth consecutive rate cut.
- The Committee assessed that annual consumer price inflation remains near the midpoint of the MPC’s 1 to 3% target band; inflation expectations are at target and core inflation continues to fall towards the target mid-point.
- Economic activity in New Zealand remains subdued and with spare productive capacity, domestic inflation pressures continue to ease. Price and wage-setting behaviours are adapting to a low-inflation environment while the price of imports has fallen, also contributing to lower headline inflation.
- Economic growth is expected to recover during 2025 as lower interest rates will encourage spending, although elevated global economic uncertainty is expected to weigh on business investment decisions. Higher prices for some key commodities and a lower exchange rate will increase export revenues and employment growth is expected to pick up in the second half of the year as the domestic economy recovers.
- Global economic growth is expected to remain subdued in the near term as geopolitics, including uncertainty about trade barriers, is likely to weaken global growth. Global economic activity is also likely to remain fragile over the medium term given increasing geoeconomic fragmentation.
- Consumer price inflation is expected to be volatile in the near term, due to a lower exchange rate and higher petrol prices. Nevertheless, the Committee is well placed to maintain price stability over the medium term.
- The economic outlook remains consistent with inflation remaining in the band over the medium term, giving the Committee confidence to continue lowering the OCR. If economic conditions continue to evolve as projected, the Committee has scope to lower the OCR further through 2025.
- The next meeting is on 9 April 2025.
Next 24 Hours Bias
Medium Bullish
The Japanese Yen (JPY)
Key news events today
No major news events.
What can we expect from JPY today?
The yen continued to see strong inflows as it appreciated strongly versus the greenback. Demand for safe-haven currencies such as the yen amidst the backdrop of global trade uncertainties has driven USD/JPY under 148 this week. This currency pair has shed almost 2% this week, with overhead pressures remaining firmly intact.
Central Bank Notes:
- The Policy Board of the Bank of Japan decided on 24 January, by an 8-1 majority vote, to set the following guidelines for money market operations for the inter-meeting period:
- The Bank will encourage the uncollateralized overnight call rate to remain at around 0.5%.
- The Bank will embark on a plan to reduce the amount of its monthly outright purchases of JGBs so that it will be about 3 trillion yen in January-March 2026; the amount will be cut down by about 400 billion yen each calendar quarter in principle.
- Japan’s economy has recovered moderately, although some weakness has been seen in part. Exports and industrial production have been more or less flat while corporate profits have been on an improving trend and business sentiment has stayed at a favourable level.
- The employment and income situation has improved moderately while private consumption has been on a moderately increasing trend despite the impact of price rises and other factors.
- On the price front, the year-on-year rate of increase in the consumer price index (CPI, all items less fresh food) has been at around 3% recently, as services prices have continued to rise moderately, reflecting factors such as wage increases, although the effects of a pass-through to consumer prices of cost increases led by the past rise in import prices have waned.
- Inflation expectations have risen moderately while underlying CPI inflation has been increasing gradually toward the price stability target of 2%. With wages continuing to rise, there has been an increase in moves to reflect higher costs, such as increased personnel expenses and distribution costs, in selling prices.
- Japan’s economy is likely to keep growing at a pace above its potential growth rate, with overseas economies continuing to grow moderately and as a virtuous cycle from income to spending gradually intensifies against the background of factors such as accommodative financial conditions.
- The next meeting is on 19 March 2025.
Next 24 Hours Bias
Weak Bearish
The Euro (EUR)
Key news events today
ECB President Lagarde’s Speech (9:30 am GMT)
What can we expect from EUR today?
As widely expected, the ECB lowered its three key interest rates by 25 basis points (bps), reducing the deposit facility rate to 2.50%, the main refinancing rate to 2.65%, and the marginal lending rate to 2.90% – the decision reflecting an updated assessment of the inflation outlook and monetary policy transmission. This central bank acknowledged that monetary policy was becoming meaningfully less restrictive, easing borrowing costs for businesses and households. Inflation is projected to average 2.3% in 2025, 1.9% in 2026, and 2.0% in 2027, with core inflation also nearing the 2% target. Although domestic inflation remains elevated due to delayed wage and price adjustments, wage growth is moderating. Economic growth forecasts were revised downward to 0.9% for 2025 and 1.2% for 2026, reflecting weak exports and investment.
President Lagarde will be in the spotlight on Friday once more but this time she will be speaking at the International Women’s Day event in Frankfurt where she could be probed with questions on monetary policy action by the ECB. The Euro surged more than 4% at its highest point this week and this currency pair should continue to remain elevated as the trading week comes to a close.
Central Bank Notes:
- The Governing Council reduced the three key ECB interest rates by 25 basis points on 6 March to mark the fifth successive rate cut.
- Accordingly, the interest rate on the main refinancing operations and the interest rates on the marginal lending facility and the deposit facility will be decreased to 2.65%, 2.90% and 2.50% respectively.
- The Council acknowledged that monetary policy was becoming meaningfully less restrictive, easing borrowing costs for businesses and households with inflation projected to average 2.3% in 2025, 1.9% in 2026, and 2.0% in 2027, while core inflation also neared the 2% target.
- Although domestic inflation remains elevated due to delayed wage and price adjustments, wage growth is moderating.
- Economic growth forecasts were revised downward to 0.9% for 2025 and 1.2% for 2026, reflecting weak exports and investment.
- The asset purchase programme (APP) and pandemic emergency purchase programme (PEPP) portfolios are declining at a measured and predictable pace, as the Eurosystem no longer reinvests the principal payments from maturing securities.
- The ECB remains data-dependent and will adjust its policy as needed to ensure inflation stabilizes around its 2% medium-term target without committing to a specific rate path.
- The next meeting is on 17 April 2025.
Next 24 Hours Bias
Medium Bullish
The Swiss Franc (CHF)
Key news events today
No major news events.
What can we expect from CHF today?
Demand for safe-haven currencies such as the franc amidst the backdrop of global trade uncertainties has driven USD/CHF under 0.8900 this week. This currency pair has already dived over 2% this week and it looks set to break under 0.8800 by the end of Friday’s trading session.
Central Bank Notes:
- The SNB eased monetary policy by lowering its key policy rate by 50 basis points, going from 1.00% to 0.50% on 12 December, marking the fourth consecutive reduction.
- Underlying inflationary pressure has decreased again this quarter.
- Inflation in the period since the last monetary policy assessment has again been lower than expected as it decreased from 1.1% in August to 0.7% in November; both goods and services contributed to this decline.
- In the shorter term, the new conditional inflation forecast is below that of September: 1.1% for 2024, 0.3% for 2025 and 0.8% for 2026, based on the assumption that the SNB policy rate is 0.5% over the entire forecast horizon.
- GDP growth in Switzerland was only modest in the third quarter of 2024 with growth in the services sector again somewhat stronger, while value added in manufacturing declined.
- There was a further slight increase in unemployment, and employment growth was subdued while the utilisation of overall production capacity was normal.
- The SNB anticipates GDP growth of around 1% this year while currently expecting growth of between 1.0% and 1.5% for 2025.
- The SNB will continue to monitor the situation closely and will adjust its monetary policy if necessary to ensure inflation remains within the range consistent with price stability over the medium term.
- The next meeting is on 20 March 2025.
Next 24 Hours Bias
Weak Bearish
The Pound (GBP)
Key news events today
No major news events.
What can we expect from GBP today?
Construction activity in the U.K. fell to 44.6 in February, down from 48.1 in the previous month as it missed market expectations of 49.5. The latest reading indicated a sharp decline in overall construction activity, marking the steepest drop since May 2020, driven by weak demand, elevated borrowing costs, and a shortage of new projects to replace completed ones. Residential building, contracted for a fifth consecutive month, representing the steepest decline since early 2009, excluding the pandemic period. Additionally, civil engineering activity contracted at its fastest pace since October 2020, while commercial construction declined only marginally. Meanwhile, inflows of new orders fell the most in nearly five years and the pace of job shedding was the fastest since November 2020. Despite deteriorating conditions in the construction sector, the pound was unfazed as it rallied above 1.2900 before settling around 1.2880.
Central Bank Notes:
- The Bank of England’s Monetary Policy Committee (MPC) voted by a majority of 7 to 2 to reduce the Bank Rate by 25 basis points (bps) to bring it down to 4.50% on 6 February 2025, while two members preferred to reduce it by 50 bps.
- The MPC also voted unanimously to reduce the stock of UK government bond purchases held for monetary policy purposes and financed by the issuance of central bank reserves, by £100B over the next 12 months to a total of £558B, starting in October 2024. On 18 December 2024, the stock of UK government bonds held for monetary policy purposes was £655B.
- CPI inflation was 2.5% in 2024 Q4 as domestic inflationary pressures moderated but remained somewhat elevated while some indicators eased more slowly than expected. Higher global energy costs and regulated price changes are expected to push up headline CPI inflation to 3.7% in 2025 Q3, even as underlying domestic inflationary pressures are expected to wane further.
- While CPI inflation is expected to fall back to around the 2% target thereafter, the Committee will pay close attention to any consequent signs of more lasting inflationary pressures.
- GDP growth has been weaker than expected at the time of the November Monetary Policy Report, and indicators of business and consumer confidence have declined – GDP growth is expected to pick up from the middle of this year.
- The labour market has continued to ease and is judged to be broadly in balance. Productivity growth has been weaker than previously estimated, and the Committee judges that growth in the supply capacity of the economy has weakened.
- Based on the Committee’s evolving view of the medium-term outlook for inflation, a gradual and careful approach to the further withdrawal of monetary policy restraint is appropriate and it will continue to monitor closely the risks of inflation persistence and what the evolving evidence may reveal about the balance between aggregate supply and demand in the economy.
- Monetary policy will need to continue to remain restrictive for sufficiently long until the risks to inflation returning sustainably to the 2% target in the medium term have dissipated further and the Committee will decide the appropriate degree of monetary policy restrictiveness at each meeting.
- The next meeting is on 8 May 2025.
Next 24 Hours Bias
Medium Bullish
The Canadian Dollar (CAD)
Key news events today
Labour Force Report (1:30 pm GMT)
What can we expect from CAD today?
The ongoing trade tariffs between the U.S. and Canada, raised uncertainty and volatility for the Loonie, causing the Ivey PMI to drop sharply in January as it recorded its first contraction in five months. However, PMI activity rebounded strongly in February as it jumped from 47.1 to 55.3 to mark the highest reading in seven months. The rebound was led by an increase in components such as business activity and employment. Canada will also release the equivalent of its NFPs later today and the simultaneous release of their employment figures alongside the BLS’s labour data is bound to inject higher volatility for the Loonie later today.
Central Bank Notes:
- The Bank of Canada reduced its target for the overnight rate by 25 basis points bringing it down to 3% on 29 January; this marked the sixth consecutive meeting where rates were reduced.
- The bank announced its plan to complete the normalization of its balance sheet, ending quantitative tightening, and will restart asset purchases in early March, beginning gradually so that its balance sheet stabilizes and then grows modestly, in line with growth in the economy.
- Past cuts to interest rates have started to boost the economy and the recent strengthening in both consumption and housing activity is expected to continue. However, business investment remains weak while the outlook for exports is being supported by new export capacity for oil and gas.
- The Bank forecasts GDP growth will strengthen in 2025 and now projects GDP will grow by 1.8% in both 2025 and 2026, somewhat higher than potential growth.
- The labour market remains soft, with the unemployment rate at 6.7% in December. Job growth has strengthened in recent months, after lagging growth in the labour force for more than a year. Wage pressures, which have proven sticky, are showing some signs of easing.
- CPI inflation remains close to 2%, with some volatility due to the temporary suspension of the GST/HST on some consumer products. Shelter price inflation is still elevated but it is easing gradually, as expected.
- A broad range of indicators, including surveys of inflation expectations and the distribution of price changes among components of the CPI, suggests that underlying inflation is close to 2% with forecasts that CPI inflation will be around the 2% target over the next two years.
- With inflation around 2%, the economy in excess supply, and recent indicators tilted towards softer growth than projected, the Governing Council decided to reduce the policy rate a further 25 basis points to support growth and keep inflation close to the middle of the 1-3% target range.
- The cumulative reduction in the policy rate since last June is substantial as lower interest rates are boosting household spending and the economy is expected to strengthen gradually and inflation to stay close to target. However, if broad-based and significant tariffs were imposed, the resilience of Canada’s economy would be tested.
- The Bank is committed to maintaining price stability for Canadians by keeping inflation close to the 2% target.
- The next meeting is on 12 March 2025.
Next 24 Hours Bias
Medium Bearish
Oil
Key news events today
No major news events.
What can we expect from Oil today?
Oil prices faced a choppy session as tariff uncertainty and plans by OPEC+ to increase production continue to linger. WTI oil swung between $67.09 and $65.59 before settling around $66.36 per barrel on Thursday. Overhead pressures remain firmly in place and this benchmark is all but certain to notch its seventh consecutive week of decline – matching the drop that occurred between the end of October and early December of 2023.
Next 24 Hours Bias
Medium Bearish
The post IC Markets Europe Fundamental Forecast | 7 March 2025 first appeared on IC Markets | Official Blog.

US Daylight Savings & Server Time Changing to GMT+3 – 2025
413138 March 7, 2025 12:39 ICMarkets Market News
Dear Client,
As part of our commitment to providing the best trading experience to our clients, we want to inform you there will be an adjustment in the trading schedule due to the US entering Daylight Savings on Sunday, 09 March 2025.
As a result, the server time will be adjusted from GMT+2 to GMT+3.
Please note that the change to GMT+3 may affect your EAs and you may need to adjust the time prior to 09 March 2025.
MT4/5:
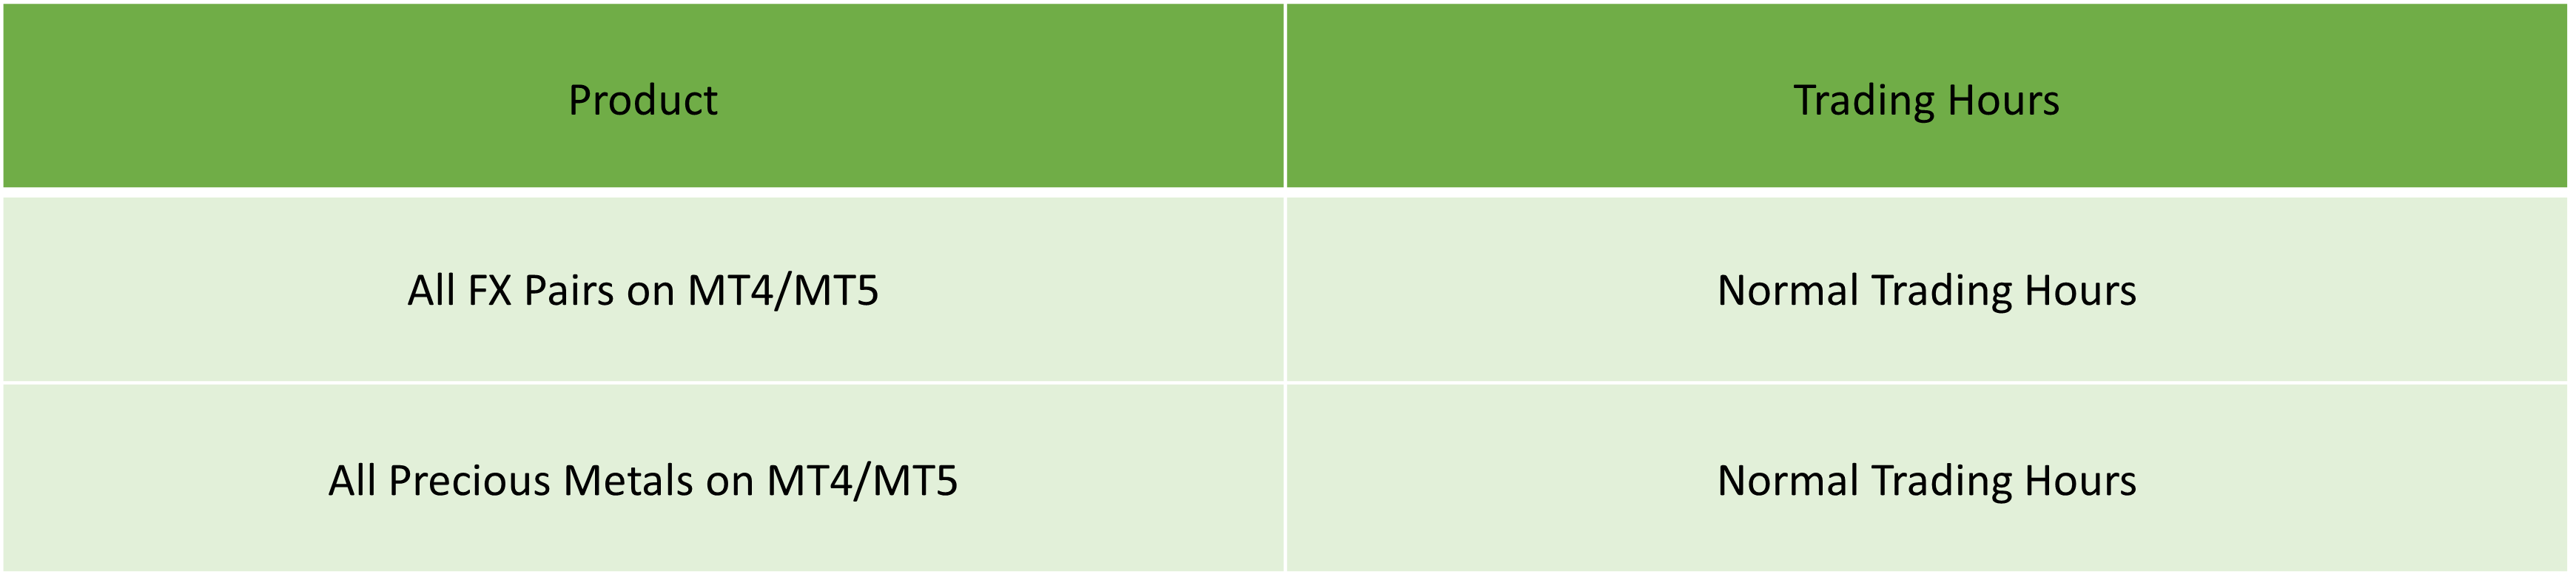
Indices:

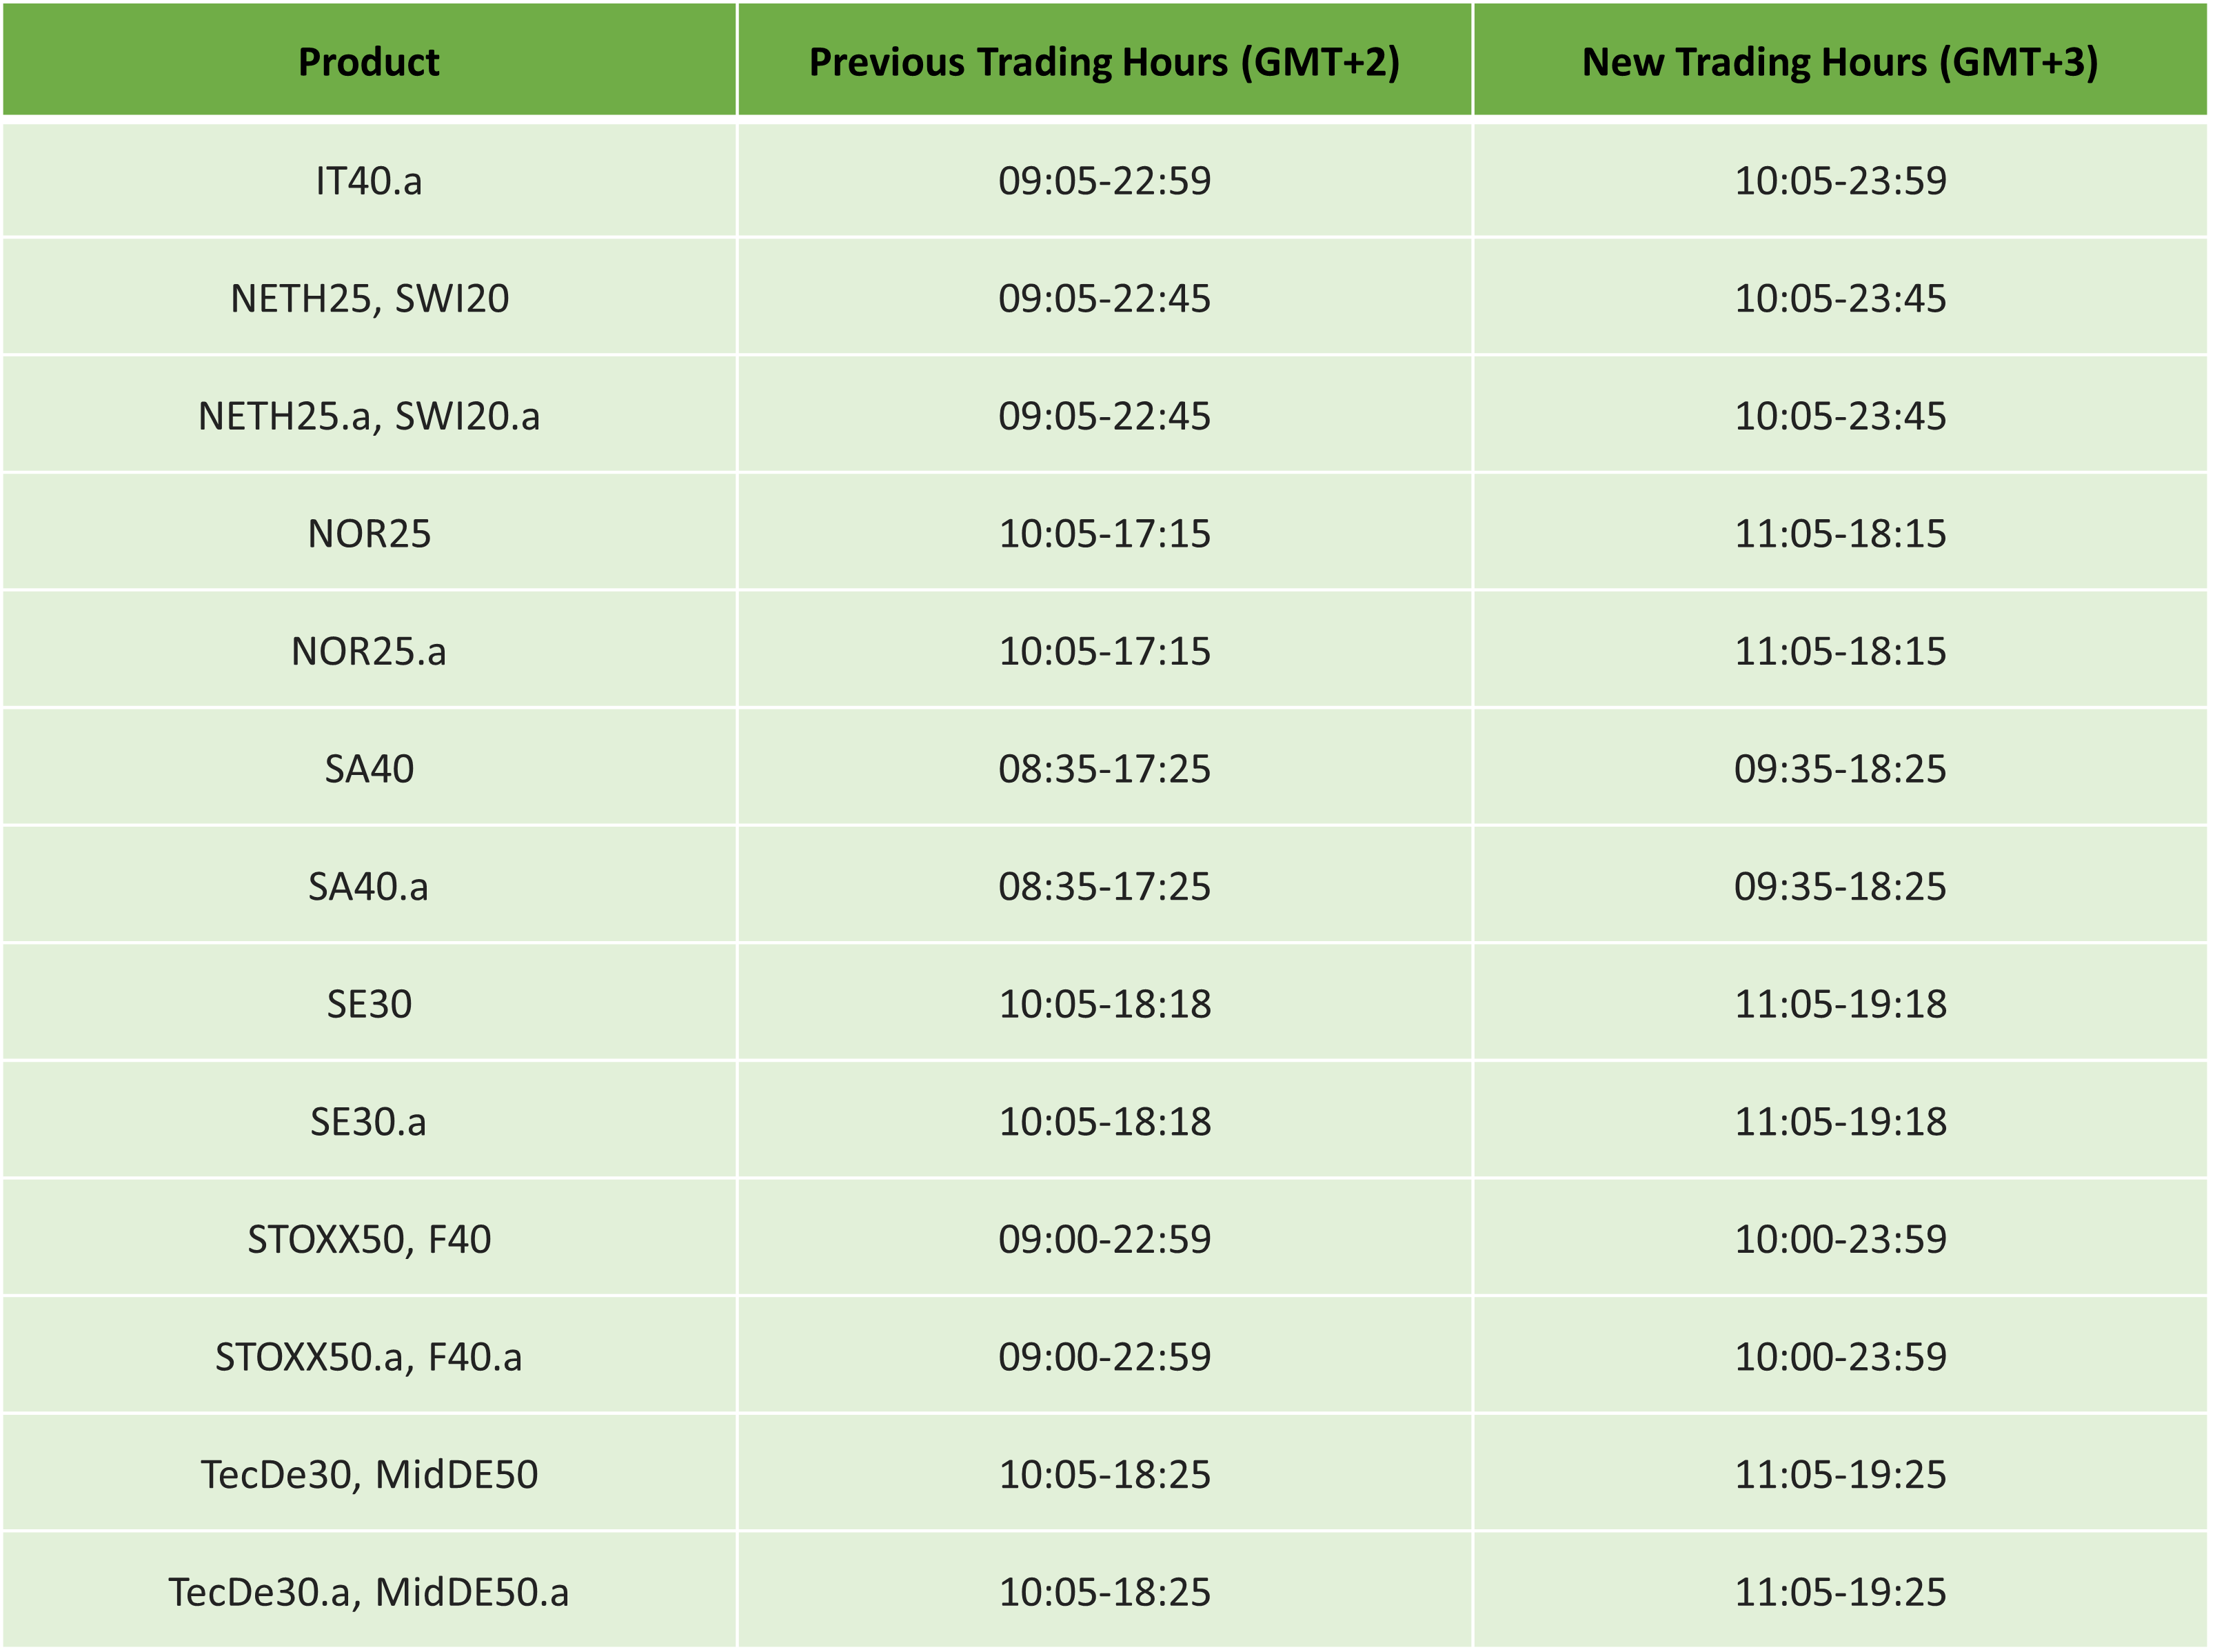
Commodities Futures:
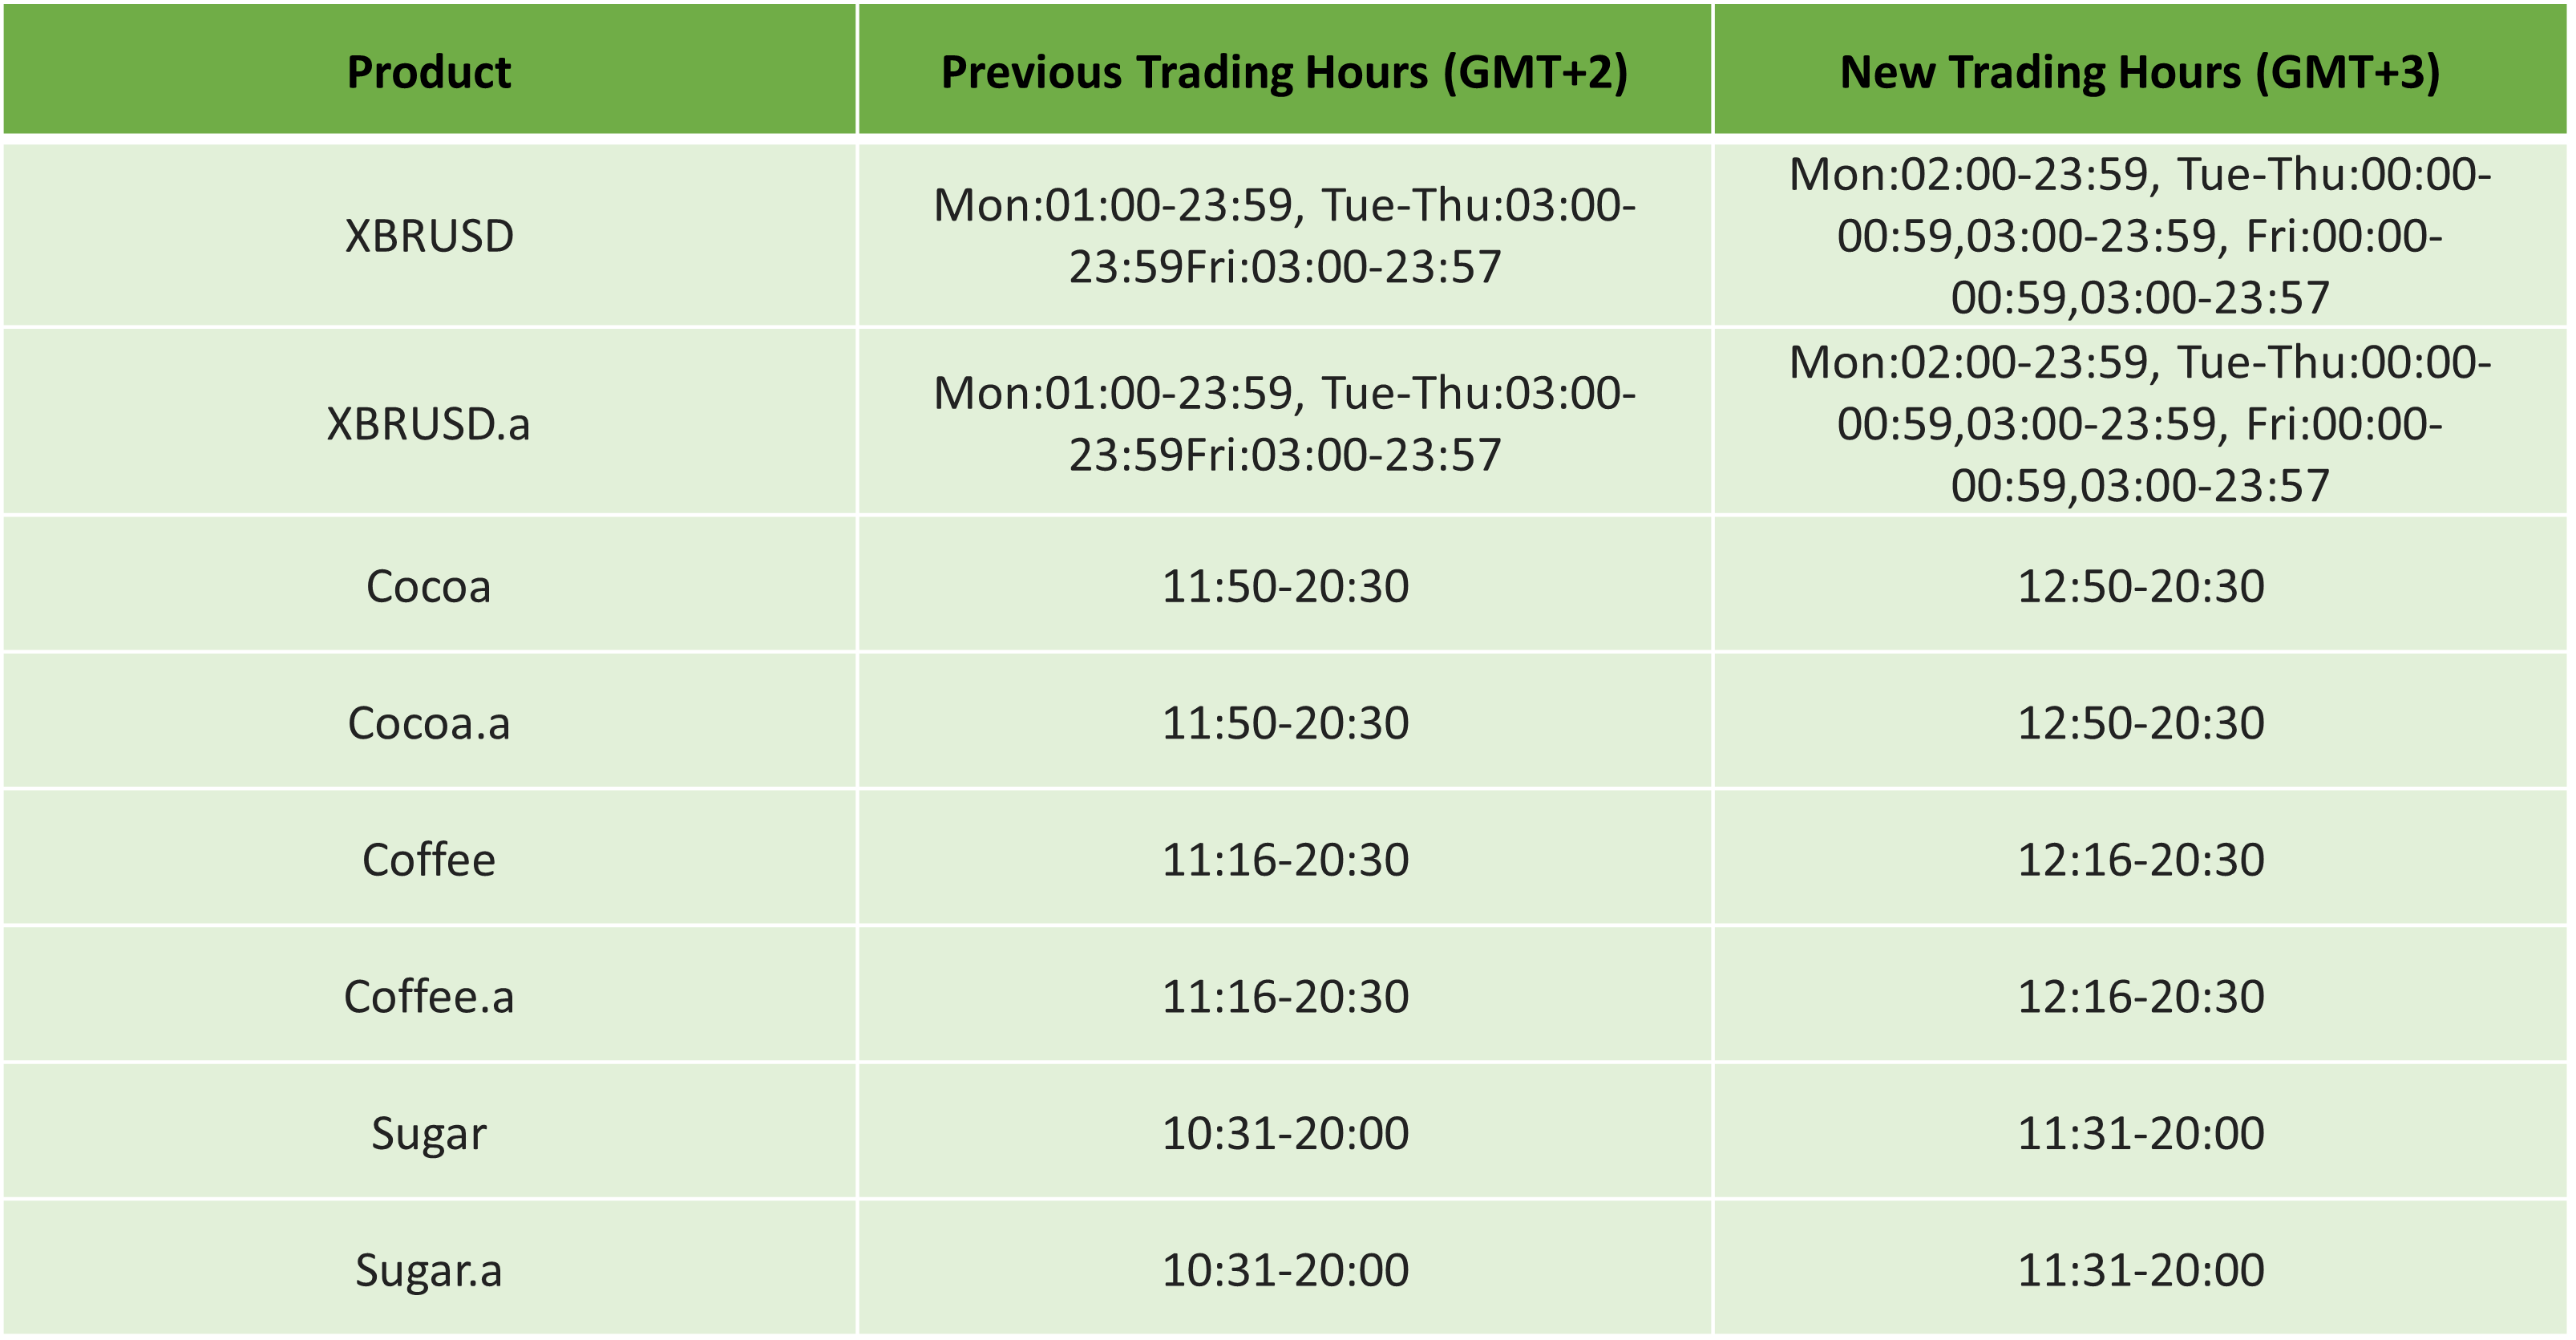
Bonds:
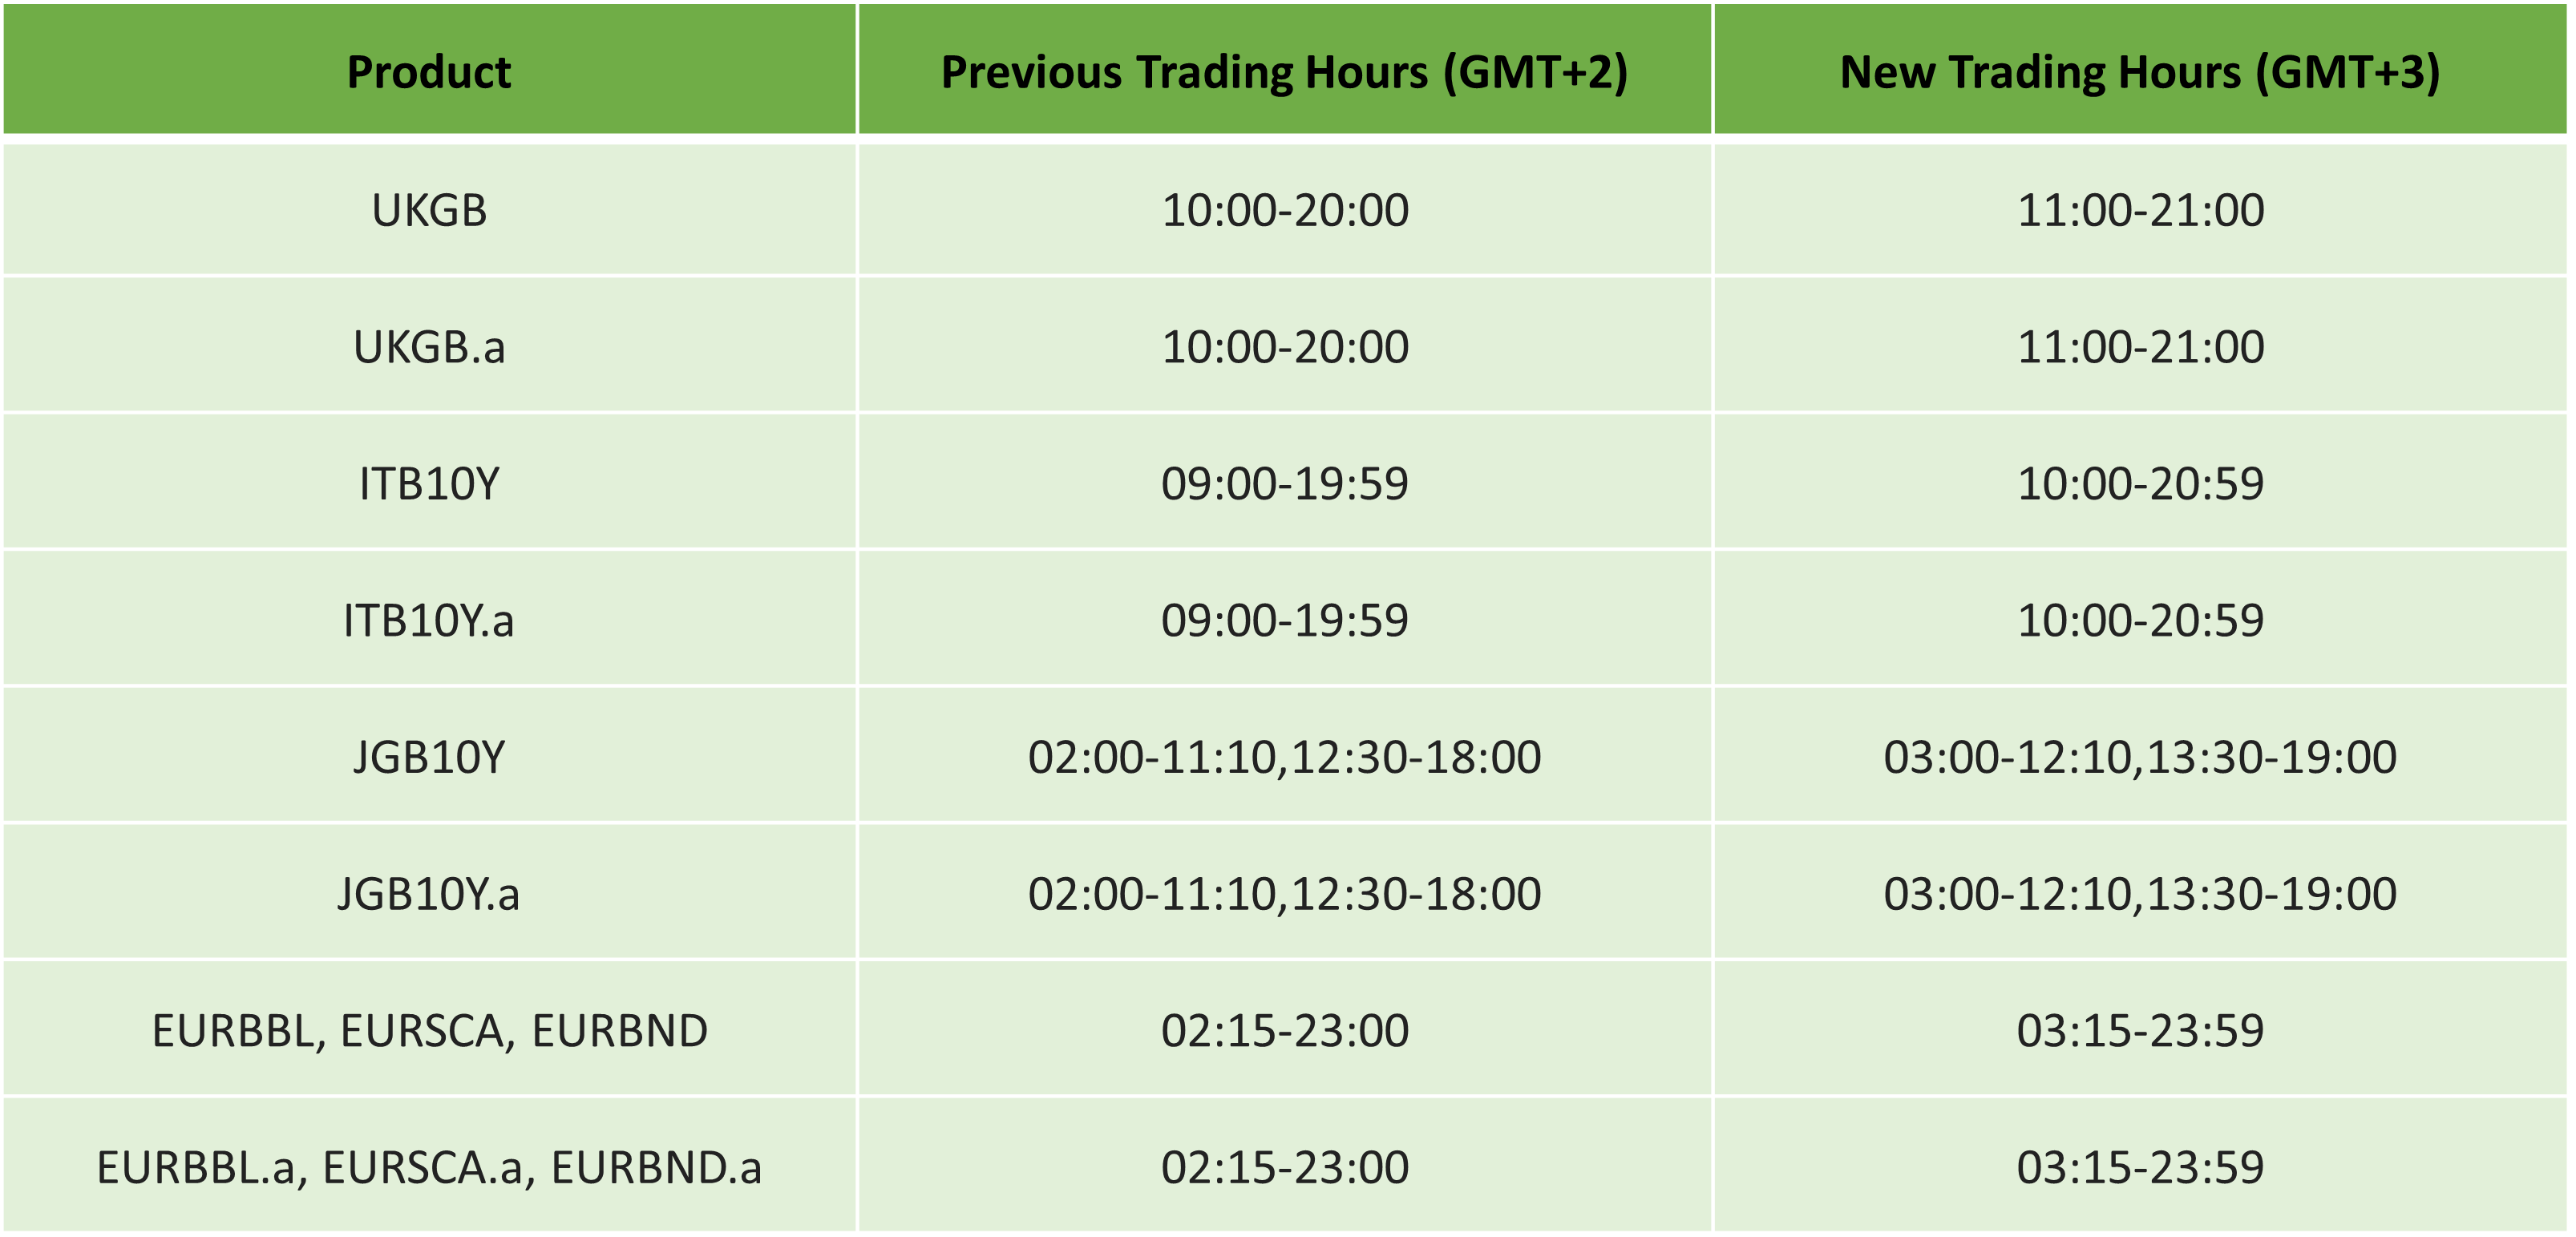
Shares:

cTrader:
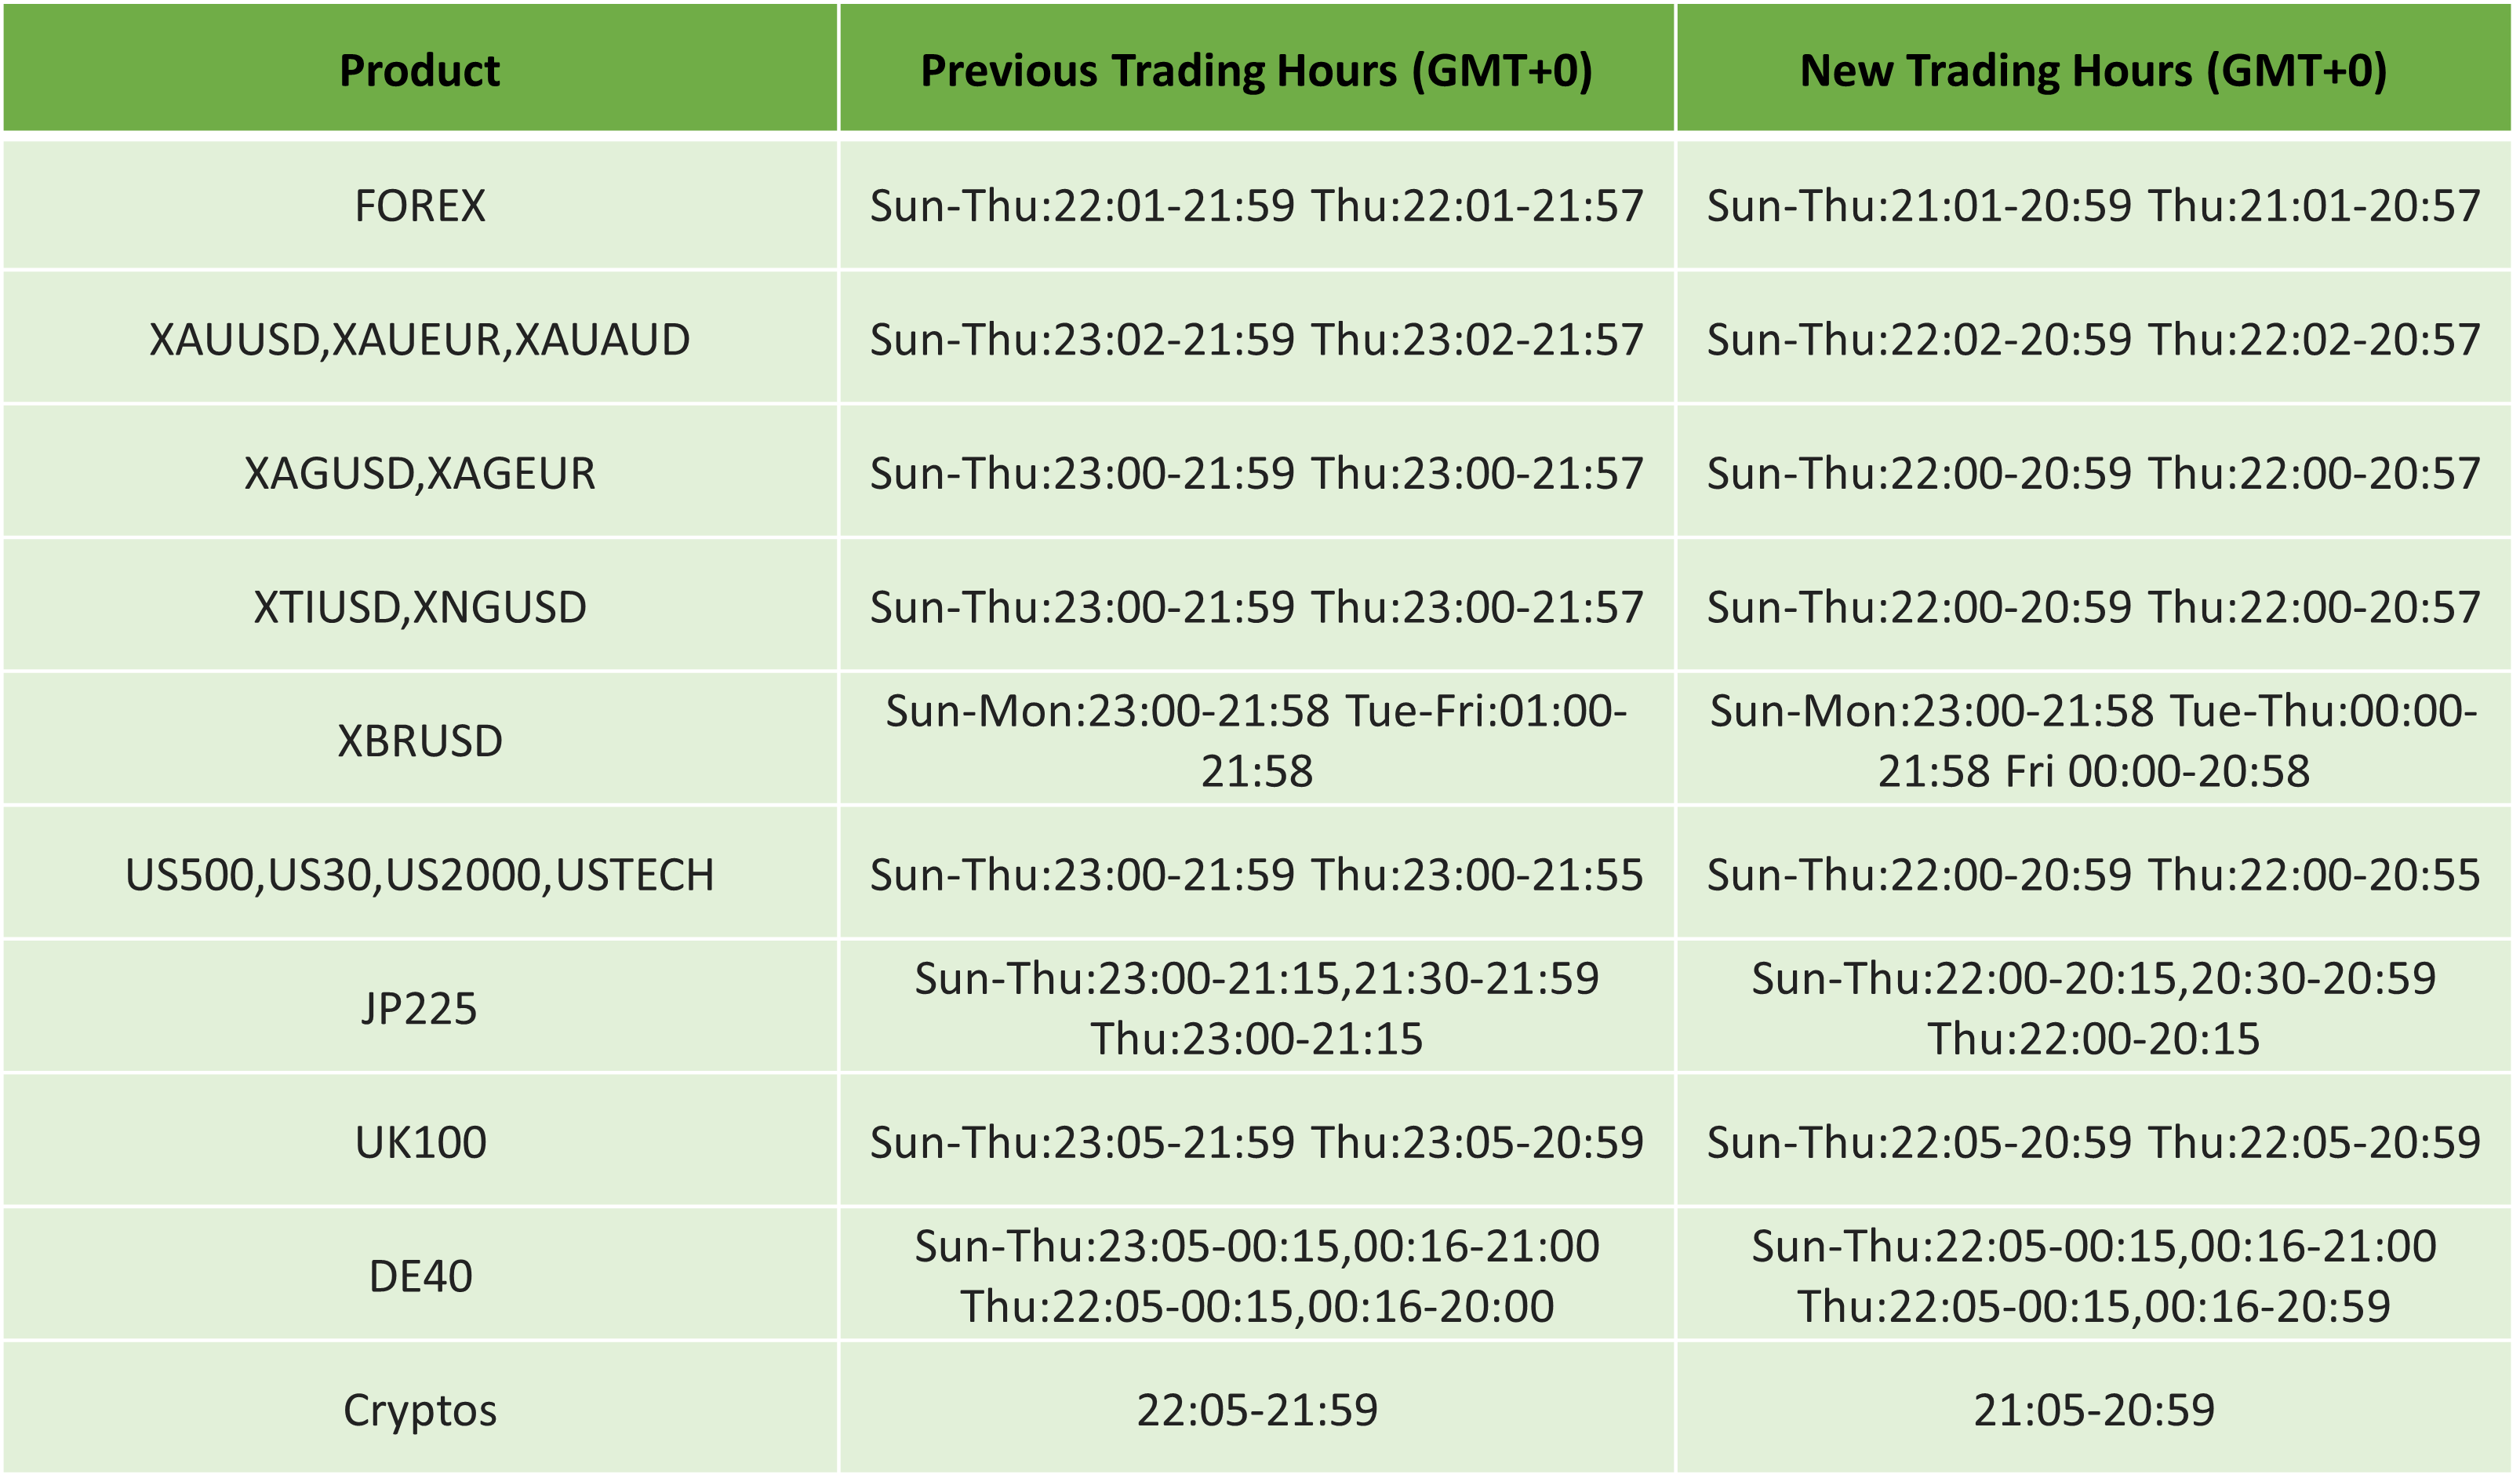
For any further assistance, please contact our Support Team.
Kind regards,
IC Markets Global.
The post US Daylight Savings & Server Time Changing to GMT+3 – 2025 first appeared on IC Markets | Official Blog.
Friday 7th March 2025: Technical Outlook and Review
413135 March 7, 2025 11:14 ICMarkets Market News
DXY (US Dollar Index):
Potential Direction: Bullish
Overall momentum of the chart: Bearish
Price could potentially make a bullish bounce off the pivot and rise towards the 1st resistance.
Pivot: 103.98
Supporting reasons: Identified as an overlap support that aligns with a confluence of Fibonacci levels i.e. the 61.8% retracement, the 100% projection and the 127.2% extension, indicating a potential area where buying interests could pick up to stage a minor rebound.
1st support: 102.32
Supporting reasons: Identified as a pullback support that aligns with a confluence of Fibonacci levels i.e. the 78.6% retracement and the 161.8% extension, indicating a potential area where the price could stabilize once again.
1st resistance: 105.26
Supporting reasons: Identified as a pullback resistance that aligns with a 38.2% Fibonacci retracement, indicating a potential level that could cap further upward movement.
EUR/USD:
Potential Direction: Bearish
Overall momentum of the chart: Bullish
Price could rise towards the pivot and potentially make a bearish reversal off this level to pull back toward the 1st support.
Pivot: 1.0930
Supporting reasons: Identified as a swing-high resistance, indicating a potential area where selling pressure could intensify.
1st support: 1.0698
Supporting reasons: Identified as a pullback support, indicating a potential area where the price could stabilize once more.
1st resistance: 1.1085
Supporting reasons: Identified as a pullback resistance, indicating a potential area that could halt any further upward movement.
EUR/JPY:
Potential Direction: Bullish
Overall momentum of the chart: Bullish
Price could fall towards the pivot and potentially make a bullish bounce off this level to rise towards the 1st resistance.
Pivot: 159.01
Supporting reasons: Identified as an overlap support that aligns close to a 38.2% Fibonacci retracement, indicating a potential area where buying interests could pick up to resume the uptrend.
1st support: 158.10
Supporting reasons: Identified as a pullback support, indicating a potential area where the price could stabilize once again.
1st resistance: 161.18
Supporting reasons: Identified as a multi-swing-high resistance, indicating a potential area that could halt any further upward movement.
EUR/GBP:
Potential Direction: Bullish
Overall momentum of the chart: Bullish
Price has made a bullish reversal close to the pivot and could potentially rise towards the 1st resistance.
Pivot: 0.8355
Supporting reasons: Identified as a pullback support, indicating a potential area where buying interests could pick up to resume the uptrend.
1st support: 0.8319
Supporting reasons: Identified as a pullback support, indicating a potential area where the price could stabilize once more.
1st resistance: 0.8425
Supporting reasons: Identified as a pullback resistance that aligns with the 78.6% Fibonacci retracement, indicating a potential level that could cap further upward movement.
GBP/USD:
Potential Direction: Bullish
Overall momentum of the chart: Bullish
Price could fall towards the pivot and potentially make a bullish bounce off this level to rise towards the 1st resistance.
Pivot: 1.2860
Supporting reasons: Identified as a pullback support, indicating a potential area where buying interests could pick up to resume the uptrend.
1st support: 1.2721
Supporting reasons: Identified as an overlap support, acting as a potential level where the price could stabilize once again.
1st resistance: 1.3047
Supporting reasons: Identified as a multi-swing-high resistance, indicating a potential level that could cap further upward movement.
GBP/JPY:
Potential Direction: Bearish
Overall momentum of the chart: Neutral
Price has made a bearish reversal off the pivot and could potentially fall towards the 1st support.
Pivot: 191.05
Supporting reasons: Identified as a pullback resistance, indicating a potential area where selling pressures could intensify.
1st support: 188.57
Supporting reasons: Identified as a swing-low support, indicating a potential level where the price could stabilize once more.
1st resistance: 192.32
Supporting reasons: Identified as a swing-high resistance, indicating a potential level that could cap further upward movement.
USD/CHF:
Potential Direction: Bearish
Overall momentum of the chart: Bearish
Price has made a bearish reversal off the pivot and could potentially fall towards the 1st support.
Pivot: 0.8914
Supporting reasons: Identified as an overlap resistance, indicating a potential area where selling pressures could intensify.
1st support: 0.8749
Supporting reasons: Identified as a swing-low support that aligns with a 100% Fibonacci projection, indicating a potential level where the price could stabilize once again.
1st resistance: 0.9031
Supporting reasons: Identified as a swing-high resistance, indicating a potential level that could cap further upward movement.
USD/JPY:
Potential Direction: Bearish
Overall momentum of the chart: Bearish
Price has made a bearish reversal off the pivot and could potentially fall towards the 1st support.
Pivot: 148.24
Supporting reasons: Identified as a pullback resistance, indicating a potential area where selling pressures could intensify.
1st support: 146.96
Supporting reasons: Identified as a pullback support that aligns with a 161.8% Fibonacci extension, suggesting a potential area where the price could stabilize once more.
1st resistance: 149.98
Supporting reasons: Identified as a swing-high resistance, indicating a potential level that could cap further upward movement.
USD/CAD:
Potential Direction: Bearish
Overall momentum of the chart: Bearish
Price is rising towards the pivot and could potentially make a bearish reversal off this level to fall towards the 1st support.
Pivot: 1.4359
Supporting reasons: Identified as an overlap resistance that aligns with a 38.2% Fibonacci retracement, indicating a potential area where selling pressures could intensify.
1st support: 1.4243
Supporting reasons: Identified as an overlap support that aligns close to a 78.6% Fibonacci retracement, indicating a key level where the price could stabilize once more.
1st resistance: 1.4537
Supporting reasons: Identified as a multi-swing-high resistance that aligns close to a 61.8% Fibonacci retracement, indicating a potential area that could halt any further upward movement.
AUD/USD:
Potential Direction: Bearish
Overall momentum of the chart: Bullish
Price has made a bearish reversal off the pivot and could potentially fall towards the 1st support.
Pivot: 0.6355
Supporting reasons: Identified as an overlap resistance that aligns close to a 78.6% Fibonacci retracement, indicating a potential area where selling pressures could intensify.
1st support: 0.6270
Supporting reasons: Identified as a pullback support that aligns close to a 50% Fibonacci retracement, suggesting a potential area where the price could stabilize once again.
1st resistance: 0.6401
Supporting reasons: Identified as a swing-high resistance, indicating a potential area that could halt any further upward movement.
NZD/USD
Potential Direction: Bullish
Overall momentum of the chart: Bullish
Price is falling towards the pivot and could potentially make a bullish bounce off this level to rise towards the 1st resistance.
Pivot: 0.5693
Supporting reasons: Identified as an overlap support that aligns with a 38.2% Fibonacci retracement, indicating a potential area where buying interests could pick up to resume the uptrend.
1st support: 0.5665
Supporting reasons: Identified as a pullback support that aligns close to a 50% Fibonacci retracement, suggesting a potential area where the price could stabilize once more.
1st resistance: 0.5761
Supporting reasons: Identified as a swing-high resistance, indicating a potential area that could halt any further upward movement.
US30 (DJIA):
Potential Direction: Bullish
Overall momentum of the chart: Bearish
Price could fall towards the pivot and potentially make a bullish bounce off this level to rise towards the 1st resistance.
Pivot: 42,455.02
Supporting reasons: Identified as a multi-swing-low support, indicating a potential area where buying interests could pick up to stage a minor rebound.
1st support: 41,674.92
Supporting reasons: Identified as a swing-low support, indicating a potential level where the price could stabilize once again.
1st resistance: 43,150.60
Supporting reasons: Identified as an overlap resistance that aligns close to a 50% Fibonacci retracement, indicating a potential area that could halt any further upward movement.
DE40 (DAX):
Potential Direction: Bearish
Overall momentum of the chart: Neutral
Price could rise towards the pivot and could potentially make a bearish reversal off this level to pull back towards the 1st support.
Pivot: 23,582.97
Supporting reasons: Identified as a resistance level that aligns with a 127.2% Fibonacci extension, indicating a potential area where selling pressures could intensify.
1st support: 22,937.80
Supporting reasons: Identified as an overlap support that aligns close to a 50% Fibonacci retracement, indicating a key level where the price could stabilize once more.
1st resistance: 23,928.94
Supporting reasons: Identified as a resistance level that aligns with a 161.8% Fibonacci extension, indicating a potential area that could halt any further upward movement.
US500 (S&P 500):
Potential Direction: Bearish
Overall momentum of the chart: Bearish
Price could rise towards the pivot and potentially make a bearish reversal off this level to fall towards the 1st support.
Pivot: 5,844.90
Supporting reasons: Identified as an overlap resistance that aligns close to a 50% Fibonacci retracement, indicating a potential area where selling pressures could intensify. The presence of the red Ichimoku Cloud adds further significance to the strength of the bearish momentum.
1st support: 5,703.70
Supporting reasons: Identified as a multi-swing-low support, indicating a potential level where the price could stabilize once again.
1st resistance: 5,914.80
Supporting reasons: Identified as a pullback resistance, indicating a potential area that could halt any further upward movement.
BTC/USD (Bitcoin):
Potential Direction: Bullish
Overall momentum of the chart: Bearish
Price is falling towards the pivot and could potentially make a bullish bounce off this level to rise towards the 1st resistance.
Pivot: 82,716.92
Supporting reasons: Identified as a swing-low support, indicating a potential area where buying interests could pick up to stage a rebound.
1st support: 80,139.21
Supporting reasons: Identified as a swing-low support that aligns close to a 127.2% Fibonacci extension, indicating a potential level where the price could stabilize once more.
1st resistance: 92,463.38
Supporting reasons: Identified as a swing-high resistance, indicating a potential area that could halt any further upward movement.
ETH/USD (Ethereum):
Potential Direction: Bearish
Overall momentum of the chart: Bearish
Price has made a bearish reversal off the pivot and could potentially fall towards the 1st support.
Pivot: 2,305.09
Supporting reasons: Identified as a swing-high resistance, indicating a potential area where selling pressures could intensify.
1st support: 2,000.46
Supporting reasons: Identified as a swing-low support that aligns close to a 127.2% Fibonacci extension, indicating a potential level where the price could stabilize once again.
1st resistance: 2,535.94
Supporting reasons: Identified as an overlap resistance, indicating a potential area that could halt any further upward movement.
WTI/USD (Oil):
Potential Direction: Bearish
Overall momentum of the chart: Bearish
Price has made a bearish reversal off the pivot and could potentially fall towards the 1st support.
Pivot: 68.48
Supporting reasons: Identified as an overlap resistance that aligns close to a confluence of Fibonacci levels i.e. the 38.2% and 61.8% retracements, indicating a potential area where selling pressures could intensify. The presence of the red Ichimoku Cloud adds further significance to the strength of the bearish momentum.
1st support: 65.64
Supporting reasons: Identified as a swing-low support, indicating a key level where the price could stabilize once more.
1st resistance: 70.40
Supporting reasons: Identified as an overlap resistance that aligns close to a 61.8% Fibonacci retracement, indicating a potential area that could halt any further upward movement.
XAU/USD (GOLD):
Potential Direction: Bearish
Overall momentum of the chart: Bullish
Price has made a bearish reversal off the pivot and could potentially fall towards the 1st support.
Pivot: 2,924.34
Supporting reasons: Identified as an overlap resistance that aligns close to the 78.6% Fibonacci retracement, indicating a potential area where selling pressure could intensify.
1st support: 2,872.95
Supporting reasons: Identified as an overlap support that aligns close to a 61.8% Fibonacci retracement, acting as a potential level where price could stabilize once again.
1st resistance: 2,952.81
Supporting reasons: Identified as a multi-swing-high resistance, indicating a potential area that could halt any further upward movement.
The accuracy, completeness and timeliness of the information contained on this site cannot be guaranteed. IC Markets does not warranty, guarantee or make any representations, or assume any liability regarding financial results based on the use of the information in the site.
News, views, opinions, recommendations and other information obtained from sources outside of www.icmarkets.com, used in this site are believed to be reliable, but we cannot guarantee their accuracy or completeness. All such information is subject to change at any time without notice. IC Markets assumes no responsibility for the content of any linked site.
The fact that such links may exist does not indicate approval or endorsement of any material contained on any linked site. IC Markets is not liable for any harm caused by the transmission, through accessing the services or information on this site, of a computer virus, or other computer code or programming device that might be used to access, delete, damage, disable, disrupt or otherwise impede in any manner, the operation of the site or of any user’s software, hardware, data or property.
The post Friday 7th March 2025: Technical Outlook and Review first appeared on IC Markets | Official Blog.
IC Markets Asia Fundamental Forecast | 7 March 2025
413134 March 7, 2025 11:14 ICMarkets Market News
IC Markets Asia Fundamental Forecast | 7 March 2025
What happened in the U.S. session?
As widely expected, the ECB lowered its three key interest rates by 25 basis points (bps), reducing the deposit facility rate to 2.50%, the main refinancing rate to 2.65%, and the marginal lending rate to 2.90% – the decision reflecting an updated assessment of the inflation outlook and monetary policy transmission. This central bank acknowledged that monetary policy was becoming meaningfully less restrictive, easing borrowing costs for businesses and households. Inflation is projected to average 2.3% in 2025, 1.9% in 2026, and 2.0% in 2027, with core inflation also nearing the 2% target. Although domestic inflation remains elevated due to delayed wage and price adjustments, wage growth is moderating. Economic growth forecasts were revised downward to 0.9% for 2025 and 1.2% for 2026, reflecting weak exports and investment.
During her press conference, ECB President Christine Lagarde underscored confidence in the disinflation process and a commitment to supporting the Euro Area’s struggling economy through gradual easing. While she confirmed the ECB’s direction toward lower rates, she kept future moves contingent on economic data, offering no definitive timeline or magnitude for additional cuts beyond the immediate 25-bps reduction. The Euro, which had already rallied 3.8% this week, continued to climb higher following the interest rate decision and President Lagarde’s presser.
What does it mean for the Asia Session?
As Asian markets digest the latest monetary policy move by the ECB, it could be a fairly quiet period for most parts of Friday until the release of the highly anticipated non-farm payrolls (NFPs) by the Bureau of Labor Statistics (BLS) during the start of the U.S. session. Trading activity and volume as well as overall market volatility are all likely to spike as that pivotal data point hits the news wires.
The Dollar Index (DXY)
Key news events today
BLS Employment Report (1:30 pm GMT)
Fed Chair Powell’s Speech (5:30 pm GMT)
U.S. President Trump’s Speech (6:30 pm GMT)
What can we expect from DXY today?
The highly anticipated NFPs will be released by the BLS where 159k jobs are expected to be added to the U.S. labour market in February while the unemployment rate remains unchanged at 4.0%. However, Wednesday’s ADP highlighted a significant slowdown in job creation for the private sector with only 77k workers added to payrolls, massively undershooting forecasts of 140k. Combined with the recent uncertainty surrounding global trade tariffs, corporates could have adopted a ‘wait and see’ approach with regard to hiring in February, suggesting weaker job growth for tonight’s data.
Later on, Federal Reserve Chairman Jerome Powell will be speaking about the economic outlook at the University of Chicago Booth School of Business US Monetary Policy Forum where audience questions are expected. There is no doubt that Chairman Powell will be peppered with queries on the latest NFP print. In addition, U.S. President Donald Trump will be participating in a roundtable discussion about cryptocurrency policy at the White House in Washington D.C. where this asset class will be looking for another bullish catalyst to bolster market sentiment.
Central Bank Notes:
- The Board of Governors of the Federal Reserve System voted unanimously to maintain the Federal Funds Rate in a target range of 4.25 to 4.50% on 29 January.
- The Committee seeks to achieve maximum employment and inflation at the rate of 2% over the longer run and judges that the risks to achieving its employment and inflation goals are roughly in balance. The economic outlook is uncertain, and the Committee is attentive to the risks to both sides of its dual mandate.
- Recent indicators suggest that economic activity has continued to expand at a solid pace while the unemployment rate has stabilized at a low level in recent months, and labour market conditions remain solid. However, inflation remains somewhat elevated.
- December’s Summary of Economic Projections (SEP) now indicates just two rate cuts in 2025 totalling 50 bps, compared to the full percentage point of reductions projected in the previous quarter.
- GDP growth forecasts were revised upward for 2024 (2.5% vs. 2% in the September projection) and 2025 (2.1% vs. 2%), while remaining steady at 2% for 2026. Similarly, PCE inflation projections have been adjusted higher for 2024 (2.4% vs. 2.3%), 2025 (2.5% vs. 2.1%), and 2026 (2.1% vs. 2%).
- In assessing the appropriate stance of monetary policy, the Committee will continue to monitor the implications of incoming information for the economic outlook and would be prepared to adjust the stance of monetary policy as appropriate if risks emerge that could impede the attainment of the Committee’s goals.
- The Committee will roll over at auction the amount of principal payments from the Federal Reserve’s holdings of Treasury securities maturing in each calendar month that exceeds a cap of $25 billion per month and redeem Treasury coupon securities up to this monthly cap and Treasury bills to the extent that coupon principal payments are less than the monthly cap.
- In addition, the Committee will reinvest the amount of principal payments from the Federal Reserve’s holdings of agency debt and agency mortgage-backed securities (MBS) received in each calendar month that exceeds a cap of $35 billion per month into Treasury securities to roughly match the maturity composition of Treasury securities outstanding.
- The next meeting runs from 18 to 19 March 2025.
Next 24 Hours Bias
Medium Bearish
Gold (XAU)
Key news events today
BLS Employment Report (1:30 pm GMT)
Fed Chair Powell’s Speech (5:30 pm GMT)
What can we expect from Gold today?
The highly anticipated NFPs will be released by the BLS where 159k jobs are expected to be added to the U.S. labour market in February while the unemployment rate remains unchanged at 4.0%. However, Wednesday’s ADP highlighted a significant slowdown in job creation for the private sector with only 77k workers added to payrolls, massively undershooting forecasts of 140k. Combined with the recent uncertainty surrounding global trade tariffs, corporates could have adopted a ‘wait and see’ approach with regard to hiring in February, suggesting weaker job growth for tonight’s data. Later on, Federal Reserve Chairman Jerome Powell will be speaking about the economic outlook at the University of Chicago Booth School of Business US Monetary Policy Forum where audience questions are expected. There is no doubt that Chairman Powell will be peppered with queries on the latest NFP print.
Next 24 Hours Bias
Weak Bearish
The Australian Dollar (AUD)
Key news events today
No major news events.
What can we expect from AUD today?
The Aussie had risen 2.5% this week before running out of steam at around 0.6363 on Thursday. This currency pair eased toward 0.6300 overnight and the downward momentum was gaining traction as Asian markets came online on the final trading day of the week.
Central Bank Notes:
- The RBA reduced the cash rate by 25 basis points to bring it down to 4.10% on 18 February, marking the first rate cut since November 2020.
- Financial conditions are restrictive, which is weighing on demand and is helping to bring down underlying inflation; growth in private demand has been subdued.
- Underlying inflation has moderated over the past three quarters with trimmed mean inflation easing to 3.2% over 2024 and it is expected to reach the 2–3% target range in early 2025, which is sooner than expected at the time of the November Statement.
- The unemployment rate declined a little in late 2024 to 4% with much of the strength in the labour market underpinned by strong employment growth, which has also bolstered household incomes.
- The announcement of tariffs between the United States and other major economies poses challenges to the global outlook but the scale and incidence of the tariffs and their effects remain highly uncertain – which may itself delay some investment until the outlook becomes clearer.
- Economic activity strengthened in China but growth there is still facing structural headwinds while domestic economic growth is forecast to pick up and the labour market is forecast to remain tight.
- If the cash rate follows the market path, underlying inflation is projected to be a little above 2.5% over most of the forecast period. The anticipated recovery of GDP growth and lingering tightness in labour market conditions are expected to sustain some upward pressure on inflation.
- Sustainably returning inflation to target within a reasonable timeframe remains the Board’s highest priority. This is consistent with the RBA’s mandate for price stability and full employment.
- The Board will continue to rely upon the data and the evolving assessment of risks to guide its decisions, paying close attention to developments in the global economy and financial markets, trends in domestic demand, and the outlook for inflation and the labour market.
- The next meeting is on 1 April 2025.
Next 24 Hours Bias
Medium Bullish
The Kiwi Dollar (NZD)
Key news events today
No major news events.
What can we expect from NZD today?
After soaring nearly 3% this week, the Kiwi fizzled out on Thursday as it hit an overnight high of 0.5759. This currency pair was edging lower towards 0.5700 at the beginning of the Asia session as it took a breather after a strong run-up.
Central Bank Notes:
- The Monetary Policy Committee (MPC) agreed to reduce the Official Cash Rate (OCR) by 50 basis points bringing it down to 3.75% on 19 February, marking the fourth consecutive rate cut.
- The Committee assessed that annual consumer price inflation remains near the midpoint of the MPC’s 1 to 3% target band; inflation expectations are at target and core inflation continues to fall towards the target mid-point.
- Economic activity in New Zealand remains subdued and with spare productive capacity, domestic inflation pressures continue to ease. Price and wage-setting behaviours are adapting to a low-inflation environment while the price of imports has fallen, also contributing to lower headline inflation.
- Economic growth is expected to recover during 2025 as lower interest rates will encourage spending, although elevated global economic uncertainty is expected to weigh on business investment decisions. Higher prices for some key commodities and a lower exchange rate will increase export revenues and employment growth is expected to pick up in the second half of the year as the domestic economy recovers.
- Global economic growth is expected to remain subdued in the near term as geopolitics, including uncertainty about trade barriers, is likely to weaken global growth. Global economic activity is also likely to remain fragile over the medium term given increasing geoeconomic fragmentation.
- Consumer price inflation is expected to be volatile in the near term, due to a lower exchange rate and higher petrol prices. Nevertheless, the Committee is well placed to maintain price stability over the medium term.
- The economic outlook remains consistent with inflation remaining in the band over the medium term, giving the Committee confidence to continue lowering the OCR. If economic conditions continue to evolve as projected, the Committee has scope to lower the OCR further through 2025.
- The next meeting is on 9 April 2025.
Next 24 Hours Bias
Medium Bullish
The Japanese Yen (JPY)
Key news events today
No major news events.
What can we expect from JPY today?
The yen continued to see strong inflows as it appreciated strongly versus the greenback. Demand for safe-haven currencies such as the yen amidst the backdrop of global trade uncertainties has driven USD/JPY under 148 this week. This currency pair has shed almost 2% this week, with overhead pressures remaining firmly intact.
Central Bank Notes:
- The Policy Board of the Bank of Japan decided on 24 January, by an 8-1 majority vote, to set the following guidelines for money market operations for the inter-meeting period:
- The Bank will encourage the uncollateralized overnight call rate to remain at around 0.5%.
- The Bank will embark on a plan to reduce the amount of its monthly outright purchases of JGBs so that it will be about 3 trillion yen in January-March 2026; the amount will be cut down by about 400 billion yen each calendar quarter in principle.
- Japan’s economy has recovered moderately, although some weakness has been seen in part. Exports and industrial production have been more or less flat while corporate profits have been on an improving trend and business sentiment has stayed at a favourable level.
- The employment and income situation has improved moderately while private consumption has been on a moderately increasing trend despite the impact of price rises and other factors.
- On the price front, the year-on-year rate of increase in the consumer price index (CPI, all items less fresh food) has been at around 3% recently, as services prices have continued to rise moderately, reflecting factors such as wage increases, although the effects of a pass-through to consumer prices of cost increases led by the past rise in import prices have waned.
- Inflation expectations have risen moderately while underlying CPI inflation has been increasing gradually toward the price stability target of 2%. With wages continuing to rise, there has been an increase in moves to reflect higher costs, such as increased personnel expenses and distribution costs, in selling prices.
- Japan’s economy is likely to keep growing at a pace above its potential growth rate, with overseas economies continuing to grow moderately and as a virtuous cycle from income to spending gradually intensifies against the background of factors such as accommodative financial conditions.
- The next meeting is on 19 March 2025.
Next 24 Hours Bias
Weak Bearish
The Euro (EUR)
Key news events today
ECB President Lagarde’s Speech (9:30 am GMT)
What can we expect from EUR today?
As widely expected, the ECB lowered its three key interest rates by 25 basis points (bps), reducing the deposit facility rate to 2.50%, the main refinancing rate to 2.65%, and the marginal lending rate to 2.90% – the decision reflecting an updated assessment of the inflation outlook and monetary policy transmission. This central bank acknowledged that monetary policy was becoming meaningfully less restrictive, easing borrowing costs for businesses and households. Inflation is projected to average 2.3% in 2025, 1.9% in 2026, and 2.0% in 2027, with core inflation also nearing the 2% target. Although domestic inflation remains elevated due to delayed wage and price adjustments, wage growth is moderating. Economic growth forecasts were revised downward to 0.9% for 2025 and 1.2% for 2026, reflecting weak exports and investment.
President Lagarde will be in the spotlight on Friday once more but this time she will be speaking at the International Women’s Day event in Frankfurt where she could be probed with questions on monetary policy action by the ECB. The Euro surged more than 4% at its highest point this week and this currency pair should continue to remain elevated as the trading week comes to a close.
Central Bank Notes:
- The Governing Council reduced the three key ECB interest rates by 25 basis points on 6 March to mark the fifth successive rate cut.
- Accordingly, the interest rate on the main refinancing operations and the interest rates on the marginal lending facility and the deposit facility will be decreased to 2.65%, 2.90% and 2.50% respectively.
- The Council acknowledged that monetary policy was becoming meaningfully less restrictive, easing borrowing costs for businesses and households with inflation projected to average 2.3% in 2025, 1.9% in 2026, and 2.0% in 2027, while core inflation also neared the 2% target.
- Although domestic inflation remains elevated due to delayed wage and price adjustments, wage growth is moderating.
- Economic growth forecasts were revised downward to 0.9% for 2025 and 1.2% for 2026, reflecting weak exports and investment.
- The asset purchase programme (APP) and pandemic emergency purchase programme (PEPP) portfolios are declining at a measured and predictable pace, as the Eurosystem no longer reinvests the principal payments from maturing securities.
- The ECB remains data-dependent and will adjust its policy as needed to ensure inflation stabilizes around its 2% medium-term target without committing to a specific rate path.
- The next meeting is on 17 April 2025.
Next 24 Hours Bias
Medium Bullish
The Swiss Franc (CHF)
Key news events today
No major news events.
What can we expect from CHF today?
Demand for safe-haven currencies such as the franc amidst the backdrop of global trade uncertainties has driven USD/CHF under 0.8900 this week. This currency pair has already dived over 2% this week and it looks set to break under 0.8800 by the end of Friday’s trading session.
Central Bank Notes:
- The SNB eased monetary policy by lowering its key policy rate by 50 basis points, going from 1.00% to 0.50% on 12 December, marking the fourth consecutive reduction.
- Underlying inflationary pressure has decreased again this quarter.
- Inflation in the period since the last monetary policy assessment has again been lower than expected as it decreased from 1.1% in August to 0.7% in November; both goods and services contributed to this decline.
- In the shorter term, the new conditional inflation forecast is below that of September: 1.1% for 2024, 0.3% for 2025 and 0.8% for 2026, based on the assumption that the SNB policy rate is 0.5% over the entire forecast horizon.
- GDP growth in Switzerland was only modest in the third quarter of 2024 with growth in the services sector again somewhat stronger, while value added in manufacturing declined.
- There was a further slight increase in unemployment, and employment growth was subdued while the utilisation of overall production capacity was normal.
- The SNB anticipates GDP growth of around 1% this year while currently expecting growth of between 1.0% and 1.5% for 2025.
- The SNB will continue to monitor the situation closely and will adjust its monetary policy if necessary to ensure inflation remains within the range consistent with price stability over the medium term.
- The next meeting is on 20 March 2025.
Next 24 Hours Bias
Weak Bearish
The Pound (GBP)
Key news events today
No major news events.
What can we expect from GBP today?
Construction activity in the U.K. fell to 44.6 in February, down from 48.1 in the previous month as it missed market expectations of 49.5. The latest reading indicated a sharp decline in overall construction activity, marking the steepest drop since May 2020, driven by weak demand, elevated borrowing costs, and a shortage of new projects to replace completed ones. Residential building, contracted for a fifth consecutive month, representing the steepest decline since early 2009, excluding the pandemic period. Additionally, civil engineering activity contracted at its fastest pace since October 2020, while commercial construction declined only marginally. Meanwhile, inflows of new orders fell the most in nearly five years and the pace of job shedding was the fastest since November 2020. Despite deteriorating conditions in the construction sector, the pound was unfazed as it rallied above 1.2900 before settling around 1.2880.
Central Bank Notes:
- The Bank of England’s Monetary Policy Committee (MPC) voted by a majority of 7 to 2 to reduce the Bank Rate by 25 basis points (bps) to bring it down to 4.50% on 6 February 2025, while two members preferred to reduce it by 50 bps.
- The MPC also voted unanimously to reduce the stock of UK government bond purchases held for monetary policy purposes and financed by the issuance of central bank reserves, by £100B over the next 12 months to a total of £558B, starting in October 2024. On 18 December 2024, the stock of UK government bonds held for monetary policy purposes was £655B.
- CPI inflation was 2.5% in 2024 Q4 as domestic inflationary pressures moderated but remained somewhat elevated while some indicators eased more slowly than expected. Higher global energy costs and regulated price changes are expected to push up headline CPI inflation to 3.7% in 2025 Q3, even as underlying domestic inflationary pressures are expected to wane further.
- While CPI inflation is expected to fall back to around the 2% target thereafter, the Committee will pay close attention to any consequent signs of more lasting inflationary pressures.
- GDP growth has been weaker than expected at the time of the November Monetary Policy Report, and indicators of business and consumer confidence have declined – GDP growth is expected to pick up from the middle of this year.
- The labour market has continued to ease and is judged to be broadly in balance. Productivity growth has been weaker than previously estimated, and the Committee judges that growth in the supply capacity of the economy has weakened.
- Based on the Committee’s evolving view of the medium-term outlook for inflation, a gradual and careful approach to the further withdrawal of monetary policy restraint is appropriate and it will continue to monitor closely the risks of inflation persistence and what the evolving evidence may reveal about the balance between aggregate supply and demand in the economy.
- Monetary policy will need to continue to remain restrictive for sufficiently long until the risks to inflation returning sustainably to the 2% target in the medium term have dissipated further and the Committee will decide the appropriate degree of monetary policy restrictiveness at each meeting.
- The next meeting is on 8 May 2025.
Next 24 Hours Bias
Medium Bullish
The Canadian Dollar (CAD)
Key news events today
Labour Force Report (1:30 pm GMT)
What can we expect from CAD today?
The ongoing trade tariffs between the U.S. and Canada, raised uncertainty and volatility for the Loonie, causing the Ivey PMI to drop sharply in January as it recorded its first contraction in five months. However, PMI activity rebounded strongly in February as it jumped from 47.1 to 55.3 to mark the highest reading in seven months. The rebound was led by an increase in components such as business activity and employment. Canada will also release the equivalent of its NFPs later today and the simultaneous release of their employment figures alongside the BLS’s labour data is bound to inject higher volatility for the Loonie later today.
Central Bank Notes:
- The Bank of Canada reduced its target for the overnight rate by 25 basis points bringing it down to 3% on 29 January; this marked the sixth consecutive meeting where rates were reduced.
- The bank announced its plan to complete the normalization of its balance sheet, ending quantitative tightening, and will restart asset purchases in early March, beginning gradually so that its balance sheet stabilizes and then grows modestly, in line with growth in the economy.
- Past cuts to interest rates have started to boost the economy and the recent strengthening in both consumption and housing activity is expected to continue. However, business investment remains weak while the outlook for exports is being supported by new export capacity for oil and gas.
- The Bank forecasts GDP growth will strengthen in 2025 and now projects GDP will grow by 1.8% in both 2025 and 2026, somewhat higher than potential growth.
- The labour market remains soft, with the unemployment rate at 6.7% in December. Job growth has strengthened in recent months, after lagging growth in the labour force for more than a year. Wage pressures, which have proven sticky, are showing some signs of easing.
- CPI inflation remains close to 2%, with some volatility due to the temporary suspension of the GST/HST on some consumer products. Shelter price inflation is still elevated but it is easing gradually, as expected.
- A broad range of indicators, including surveys of inflation expectations and the distribution of price changes among components of the CPI, suggests that underlying inflation is close to 2% with forecasts that CPI inflation will be around the 2% target over the next two years.
- With inflation around 2%, the economy in excess supply, and recent indicators tilted towards softer growth than projected, the Governing Council decided to reduce the policy rate a further 25 basis points to support growth and keep inflation close to the middle of the 1-3% target range.
- The cumulative reduction in the policy rate since last June is substantial as lower interest rates are boosting household spending and the economy is expected to strengthen gradually and inflation to stay close to target. However, if broad-based and significant tariffs were imposed, the resilience of Canada’s economy would be tested.
- The Bank is committed to maintaining price stability for Canadians by keeping inflation close to the 2% target.
- The next meeting is on 12 March 2025.
Next 24 Hours Bias
Medium Bearish
Oil
Key news events today
No major news events.
What can we expect from Oil today?
Oil prices faced a choppy session as tariff uncertainty and plans by OPEC+ to increase production continue to linger. WTI oil swung between $67.09 and $65.59 before settling around $66.36 per barrel on Thursday. Overhead pressures remain firmly in place and this benchmark is all but certain to notch its seventh consecutive week of decline – matching the drop that occurred between the end of October and early December of 2023.
Next 24 Hours Bias
Medium Bearish
The post IC Markets Asia Fundamental Forecast | 7 March 2025 first appeared on IC Markets | Official Blog.