Articles

Forexlive European FX news wrap 17 September – German ZEW falls to a 10 month low
405797 September 17, 2024 18:39 Forexlive Latest News Market News
- Will the US retail sales later mess up the Fed odds even more?
- Dollar holds lightly changed on the day
- Gold rally stalls as traders wait on Fed decision
- Germany September ZEW survey current conditions -84.5 vs -80.0 expected
- European indices hold higher to start the day
- What are the main events for today?
- Eurostoxx futures +0.5% in early European trading
- FX option expiries for 17 September 10am New York cut
- A light one on the agenda in Europe today
- The bond market stays in focus in run up to the Fed tomorrow
- New Zealand Treasury see more positive data, but no firm sign of a recovery just yet
Markets:
- AUD leads, CAD lags on the day
- European equities higher;
S&P 500 futures up 0.24% - US 10-year yields flat at
3.618% - Gold
down 0.29% to $2,575 - WTI
crude up 0.20% to $70.23 - Bitcoin
up 1.49% to $59,069
It’s been a
quiet session with no major news releases. The only economic report was the
German ZEW which missed expectations by a big margin.
In the
markets, the mood is tentatively positive as risk assets continue to gain as we
head into the FOMC decision tomorrow. The probability for a 50 bps cut stands
now around 65%.
In the
American session, we get the US Retail Sales and the US Industrial Production
data. If we get weak readings, then the market will likely seal the 50 bps cut
with a 70%+ probability. In case the data comes out strong though, it’s
unlikely that we will see much change in the pricing although we should get closer to a 50/50 chance.
This article was written by Giuseppe Dellamotta at www.forexlive.com.
Will the US retail sales later mess up the Fed odds even more?
405796 September 17, 2024 18:14 Forexlive Latest News Market News
Last month, July retail sales nudged up by 1.0% and beat estimates here. Ten out of the thirteen categories showed an increase, so that helped. But this time around, the estimate is for headline retail sales to show a 0.2% decline. That said, ex-autos is estimated to increase by 0.2% and the more important control group is expected to be higher by 0.3% again.
The hurdle doesn’t seem too high but spending might cool a little after the hotter-than-expected July performance. That especially as we are starting to build towards the holiday spending spree in the months ahead.
In any case, it’s not so much about the details of the data at this point. This is a market that is currently trending high on emotions ever since the whole carry trade fiasco at the end of July and start of August.
And in pricing in higher odds of a 50 bps move by the Fed since last week, it looks like traders are very much caught in that again.
As such, I would argue that the risks are asymmetric when it comes to the US retail sales today.
If the report is a poor one, it would just serve to exacerbate calls for a 50 bps rate cut tomorrow. That considering market players are wanting to try and force that on the Fed, or so it would seem.
But if the report is relatively in line with estimates and even perhaps showing that spending is doing fine, markets are likely to take that as a “carry on as you will” message. There might be some minor adjustments to the current pricing in favour of 25 bps but surely we won’t go as far as to pricing out the possibility of a 50 bps move.
Timiraos’ report last week certainly threw a curveball to markets. The Fed communique since Jackson Hole has been siding with a 25 bps move. But then now, traders have had to rethink whether 50 bps should still be in the picture.
And when you give traders an inch, they’ll happily take a mile. Even more so if they can lean on the data to back that up.
Either way, a poor report today will certainly make things very, very interesting going into tomorrow. That especially given the current market pricing. It will make this one of the most anticipated and watched Fed meetings in recent times.
This article was written by Justin Low at www.forexlive.com.
Dollar holds lightly changed on the day
405795 September 17, 2024 17:14 Forexlive Latest News Market News
The changes among the day remain light, with dollar pairs all holding within 10 pips change currently. It’s just one of those days where even if there are any moves, one shouldn’t look too much into it. At this point, it’s all about the Fed tomorrow.
USD/JPY was a bit more volatile in Asia, trading up to 141.25 but is now flat at 140.60. Meanwhile, EUR/USD saw a light extension of its range earlier to 1.1146 but is now flat again around 1.1135. So, there’s not really a whole lot to talk about in terms of the movement today.
In the equities space though, US futures are pushing higher with tech shares seen rebounding. S&P 500 futures are up 0.4% with Nasdaq futures up 0.6% currently. In the bond market, 2-year yields remain on edge at 3.556% and 10-year yields down marginally on the day at 3.614%.
As for Fed pricing, traders are still seeing ~67% odds of a 50 bps rate cut currently.
This article was written by Justin Low at www.forexlive.com.
Gold rally stalls as traders wait on Fed decision
405794 September 17, 2024 17:00 Forexlive Latest News Market News
Gold jumped higher in trading last week to fresh record highs but the latest leg is falling just shy of the $2,600 mark. Buyers are still in control but it looks like we might have to wait until the Fed tomorrow before deciding on where to go from here. As traders step up bets for a 50 bps rate cut since last week, we have seen yields fall. And that has helped prop up gold prices in turn.
But so far this week, we are seeing price action stall a fair bit and enter into a slight consolidation phase.
It wouldn’t be too surprising to see some profit-taking ahead of the Fed tomorrow. But what comes after, will depend on the Fed’s decision as well as how Powell chooses to communicate the central bank’s next steps.
2-year Treasury yields are already on the brink and market players are just searching for some vindication.
The long-term outlook for gold remains bright. However, a key trigger for selling/profit-taking at this stage could well result in a rather violent correction. That considering gold has yet to experience any significant retracement throughout the course of this year.
For now, the next step will come down to the Fed as that will also see broader markets be impacted. That especially the dollar and yields, which will also drive gold sentiment.
This article was written by Justin Low at www.forexlive.com.
Ex Dividend 18/09/2024
405793 September 17, 2024 16:39 ICMarkets Market News
|
1
|
Ex-Dividends | ||
|---|---|---|---|
|
2
|
18/09/2024 | ||
|
3
|
Indices | Name |
Index Adjustment Points
|
|
4
|
Australia 200 CFD
|
AUS200 | 0.24 |
|
5
|
IBEX-35 Index | ES35 | |
|
6
|
France 40 CFD | F40 | |
|
7
|
Hong Kong 50 CFD
|
HK50 | |
|
8
|
Italy 40 CFD | IT40 | |
|
9
|
Japan 225 CFD
|
JP225 | |
|
10
|
EU Stocks 50 CFD
|
STOXX50 | |
|
11
|
UK 100 CFD | UK100 | |
|
12
|
US SP 500 CFD
|
US500 | 0.1 |
|
13
|
Wall Street CFD
|
US30 | 2.63 |
|
14
|
US Tech 100 CFD
|
USTEC | |
|
15
|
FTSE CHINA 50
|
CHINA50 | |
|
16
|
Canada 60 CFD
|
CA60 | |
|
17
|
Germany Tech 40 CFD
|
TecDE30 | |
|
18
|
Germany Mid 50 CFD
|
MidDE50 | |
|
19
|
Netherlands 25 CFD
|
NETH25 | |
|
20
|
Switzerland 20 CFD
|
SWI20 | |
|
21
|
Hong Kong China H-shares CFD
|
CHINAH | |
|
22
|
Norway 25 CFD
|
NOR25 | |
|
23
|
South Africa 40 CFD
|
SA40 | 65.44 |
|
24
|
Sweden 30 CFD
|
SE30 | |
|
25
|
US 2000 CFD | US2000 | |
The post Ex Dividend 18/09/2024 first appeared on IC Markets | Official Blog.
Germany September ZEW survey current conditions -84.5 vs -80.0 expected
405792 September 17, 2024 16:14 Forexlive Latest News Market News
- Prior -77.3
- Economic sentiment 3.6 vs 17.0 expected
- Prior 19.2
German investor sentiment dropped in September with the outlook also tumbling lower on the month. It’s a setback to hopes for a recovery in the economic situation. ZEW notes that there is now a noticeable decline in economic expectations. And that most respondents have already factored the ECB’s policy path into their expectations.
This article was written by Justin Low at www.forexlive.com.

Trade Canadian Dollar on the Canadian CPI Data
405790 September 17, 2024 14:39 ICMarkets Market News
Traders of the Canadian dollar are bracing for further moves in the currency later today as the latest CPI data is released. Over the weekend, Bank of Canada Governor Tiff Macklem indicated that falling oil prices and concerns in the labour market may prompt quicker rate cuts from the central bank. Should today’s CPI data come in lower than expected, confirming weaker inflationary pressures, the Loony could face additional downward pressure.
Market expectations point to a 0.2% month-on-month increase in the headline CPI, with the year-on-year median CPI projected at 2.2%. Any figures falling short of these forecasts are likely to trigger significant movements in the currency.
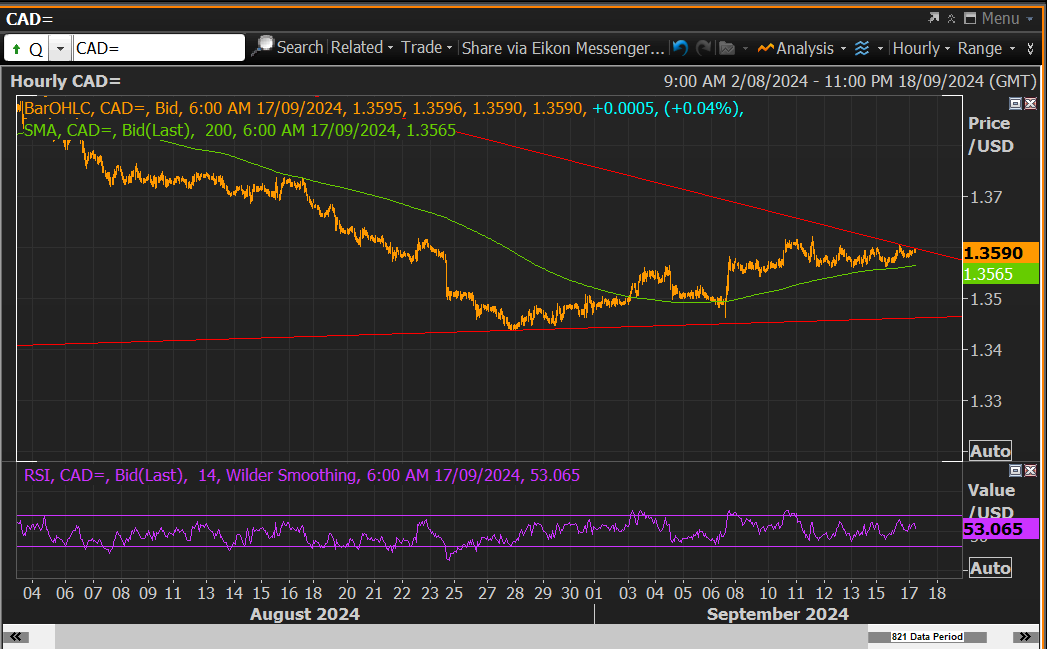
The Loony is one of the few major currencies that has depreciated against the US dollar in recent days, weighed down by lower oil prices. It is currently trading around 1.3590, just below a recent high and trendline resistance on the hourly chart. A weaker CPI print could push the pair into higher ranges, though tomorrow’s US Federal Reserve decision will play a key role in determining the longevity of such a move. Conversely, a higher-than-expected CPI print could lead to buying interest in the CAD, pulling the pair back into recent ranges, with initial support now lying at the 200-day moving average of 1.3565.
Resistance 2: 1.3622 – September High
Resistance 1: 1.3606 – Trendline Resistance
Support 1: 1.3565 – 200-Day Moving Average
Support 2: 1.3462 – Trendline Support
The post Trade Canadian Dollar on the Canadian CPI Data first appeared on IC Markets | Official Blog.
European indices hold higher to start the day
405789 September 17, 2024 14:30 Forexlive Latest News Market News
- Eurostoxx +0.5%
- Germany DAX +0.5%
- France CAC 40 +0.6%
- UK FTSE +0.7%
- Spain IBEX +0.8%
- Italy FTSE MIB +0.5%
The risk mood today is also in a decent spot, with S&P 500 futures now up 0.15%. Nasdaq futures are up 0.27% while Dow futures are up 0.11% currently. In FX, major currencies are still not up to much with dollar pairs keeping within 0.1% change across the board. It’s setting up to be a quieter one as we get stuck in the countdown to the Fed tomorrow.
This article was written by Justin Low at www.forexlive.com.
Tuesday 17th September 2024: Asia-Pacific Markets Mixed Ahead of Federal Reserve Rate Decision
405788 September 17, 2024 13:00 ICMarkets Market News
Global Markets:
- Asian Stock Markets : Nikkei down 1.50%, Shanghai Composite down 0.48%, Hang Seng up 1.18% ASX up 0.31%
- Commodities : Gold at $2605.35 (-0.14%), Silver at $31.10 (-0.14%), Brent Oil at $73.08 (0.49%), WTI Oil at $69.8 (0.58%)
- Rates : US 10-year yield at 3.635, UK 10-year yield at 3.760, Germany 10-year yield at 2.120
News & Data:
- (CAD) Manufacturing Sales m/m 1.4% vs 0.7% expected
Markets Update:
Asia-Pacific stocks saw mixed performances on Tuesday, with Japan’s Nikkei 225 falling 2% as investors anticipated the Federal Reserve’s upcoming monetary loosening cycle. The Nikkei 225 dropped 1.46%, and the Topix decreased by 1.8%, with the yen strengthening for the sixth consecutive session, trading at 140.40 against the dollar. Overnight, the yen reached 139.58, its strongest level since July 2023.
The Federal Reserve is expected to announce its first interest rate cut since March 2022. However, there is uncertainty regarding the size of the cut, as the two-day policy meeting begins. U.S. retail sales data is also being closely watched to assess consumer health ahead of the Fed’s decision.
In Asia, Singapore’s non-oil domestic exports rose 10.7% year-on-year in August but fell 4.7% from the previous month, slightly below Reuters’ forecast of a 15% annual increase. Additionally, India’s wholesale prices for August are projected to have increased by 1.85% year-on-year, a cooler reading than July’s 2.04%.
Chinese appliance maker Midea Group’s shares surged over 9% in their Hong Kong debut, marking the city’s largest listing in over three years. Hong Kong’s Hang Seng index rose 1.5%, and Australia’s S&P/ASX 200 edged up 0.31%. South Korea, mainland China, and Taiwan’s markets were closed for a holiday.
In the U.S., the Dow Jones Industrial Average climbed 0.55% to a record high of 41,622.08, while the S&P 500 increased by 0.13%. Conversely, the Nasdaq Composite fell by 0.52%, affected by declines in tech stocks.
Upcoming Events:
- 12:30 PM GMT – CAD CPI m/m
- 12:30 PM GMT – CAD Median CPI y/y
- 12:30 PM GMT – CAD Trimmed CPI y/y
- 12:30 PM GMT – CAD Common CPI y/y
- 12:30 PM GMT – CAD Core CPI m/m
- 12:30 PM GMT – USD Core Retail Sales m/m
- 12:30 PM GMT – USD Retail Sales m/m
The post Tuesday 17th September 2024: Asia-Pacific Markets Mixed Ahead of Federal Reserve Rate Decision first appeared on IC Markets | Official Blog.
IC Markets Europe Fundamental Forecast | 17 September 2024
405787 September 17, 2024 13:00 ICMarkets Market News
IC Markets Europe Fundamental Forecast | 17 September 2024
What happened in the Asia session?
It was a quiet morning as the dollar index (DXY) ranged narrowly between 100.65 and 100.75 while spot prices for gold steadied above $2,575/oz. Trading activity is likely to pick up as Europe comes online due to several macroeconomic data releases out of the Euro Area and North America. Crude prices remain supported with WTI oil hovering above $70.50 per barrel and could continue to grind higher in the latter half of the day.
What does it mean for the Europe & US sessions?
The ZEW Economic Sentiment in the Euro Area plunged from 43.7 in July down to 17.9 in August as it deteriorated for the second month in a row while marking a nine-month low. Sentiment has been plummeting due to uncertainty surrounding the economic outlook and the direction of monetary policies in this economic region. September’s forecast of 16.4 points to a third consecutive month of deterioration and a larger-than-anticipated drop could function as a potential bearish catalyst for the Euro during the European trading hours.
Inflation in Canada has moderated lower since the middle of last year as observed in the various inflation metrics such as median-, trimmed- and common-CPI. The forecasts for August point to further easing, albeit at a slower rate. Should inflationary pressures continue to dissipate further, the Loonie is likely to face headwinds and could potentially provide USD/CAD with a much-needed lift later today.
The Dollar Index (DXY)
Key news events today
Retail Sales (12:30 pm GMT)
What can we expect from DXY today?
After jumping 1% MoM in July to beat the market forecast of 0.3% by a wide margin, retail sales are now expected to decline in August – a result that would mark the fourth down month of 2024. Should sales drop more than the estimate of a 0.2%-decline, overhead pressures on the dollar are likely to build even further.
Central Bank Notes:
- The Federal Funds Rate target range remained unchanged at 5.25% to 5.50% for the eighth meeting in a row.
- The Committee seeks to achieve maximum employment and inflation at the rate of 2% over the longer run and judges that the risks to achieving its employment and inflation goals continue to move into better balance.
- The economic outlook is uncertain, and the Committee is attentive to the risks to both sides of its dual mandate.
- Recent indicators suggest that economic activity has continued to expand at a solid pace while job gains have moderated, and the unemployment rate has moved up but remains low.
- In considering any adjustments to the target range for the federal funds rate, the Committee will carefully assess incoming data, the evolving outlook, and the balance of risks and does not expect it will be appropriate to reduce the target range until it has gained greater confidence that inflation is moving sustainably toward 2%.
- In assessing the appropriate stance of monetary policy, the Committee will continue to monitor the implications of incoming information for the economic outlook and would be prepared to adjust the stance of monetary policy as appropriate if risks emerge that could impede the attainment of the Committee’s goals.
- In addition, the Committee will continue reducing its holdings of Treasury securities and agency debt and agency mortgage-backed securities. Beginning in June, the Committee slowed the pace of decline of its securities holdings by reducing the monthly redemption cap on Treasury securities from $60 billion to $25 billion.
- The Committee will maintain the monthly redemption cap on agency debt and agency mortgage-backed securities at $35 billion and will reinvest any principal payments in excess of this cap into Treasury securities.
- Next meeting runs from 17 to 18 September 2024.
Next 24 Hours Bias
Medium Bearish
Gold (XAU)
Key news events today
Retail Sales (12:30 pm GMT)
What can we expect from Gold today?
After jumping 1% MoM in July to beat the market forecast of 0.3% by a wide margin, retail sales are now expected to decline in August – a result that would mark the fourth down month of 2024. Should sales drop more than the estimate of a 0.2%-decline, overhead pressures on the dollar are likely to build even further – resulting in a potential tailwind for gold.
Next 24 Hours Bias
Medium Bullish
The Australian Dollar (AUD)
Key news events today
No major news events.
What can we expect from AUD today?
Despite uplifting data from the U.S. overnight, the Aussie remained elevated above 0.6750 but it pulled back slightly as Asian markets came online. This currency pair was trading around 0.6745 this morning and these are the support and resistance levels for today.
Support: 0.6640
Resistance: 0.6800
Central Bank Notes:
- The RBA kept the cash rate target unchanged at 4.35% on 6th August, marking the sixth consecutive pause.
- Inflation has fallen substantially since its peak in 2022, as higher interest rates have been working to bring aggregate demand and supply closer towards balance but it still remains above the midpoint of the 2 to 3% target range.
- The CPI rose by 3.9% over the year to the June quarter, demonstrating that inflation is proving persistent. In year-ended terms, underlying inflation has now been above the midpoint of the target for 11 consecutive quarters while quarterly underlying CPI inflation has fallen very little over the past year.
- The central forecasts set out in the latest SMP are for inflation to return to the target range of 2 to 3% in late 2025 and approach the midpoint in 2026. This represents a slightly slower return to target than forecast in May, based on estimates that the gap between aggregate demand and supply in the economy is larger than previously thought.
- Momentum in economic activity has been weak, as evidenced by slow growth in GDP, a rise in the unemployment rate and reports that many businesses are under pressure. In addition, there is a risk that household consumption picks up more slowly than expected, resulting in continued subdued output growth and a noticeable deterioration in the labour market.
- Inflation in underlying terms remains too high, and the latest projections show that it will be some time yet before inflation is sustainably in the target range while recent data have reinforced the need to remain vigilant to upside risks to inflation and the Board is not ruling anything in or out.
- Policy will need to be sufficiently restrictive until the Board is confident that inflation is moving sustainably towards the target range and will rely upon the incoming data and the evolving assessment of risks to guide its decisions.
- Next meeting is on 5 November 2024.
Next 24 Hours Bias
Weak Bullish
The Kiwi Dollar (NZD)
Key news events today
No major news events.
What can we expect from NZD today?
The Kiwi briefly climbed above the threshold of 0.6200 overnight before dipping under this level at the beginning of the Asia session. This currency pair was trading around 0.6185 this morning and these are the support and resistance levels for today.
Support: 0.6120
Resistance: 0.6235
Central Bank Notes:
- The Monetary Policy Committee agreed to reduce the OCR by 25 basis points, bringing it down to 5.25% in August as inflation converges on target.
- The Committee is confident that inflation is returning to within its 1-3% target band as surveyed inflation expectations, firms’ pricing behaviour, headline inflation, and a variety of core inflation measures are moving consistent with low and stable inflation.
- Economic growth remains below trend and inflation is declining across advanced economies – imported inflation into New Zealand has declined to be more consistent with pre-pandemic levels.
- Services inflation remains elevated but is also expected to continue to decline, both at home and abroad, in line with increased spare economic capacity.
- Consumer price inflation in New Zealand is expected to remain near the target mid-point over the foreseeable future.
- A broad range of high-frequency indicators point to a material weakening in domestic economic activity in recent months – these include various survey measures of business activity, electronic card transactions, vehicle traffic, house sales, filled jobs, and job vacancies; these indicators collectively provide a consistent signal that the economy contracted in recent months.
- The pace of further easing will depend on the Committee’s confidence that pricing behaviour remains consistent with a low inflation environment, and that inflation expectations are anchored around the 2% target.
- Next meeting is on 9 October 2024.
Next 24 Hours Bias
Weak Bullish
The Japanese Yen (JPY)
Key news events today
No major news events.
What can we expect from JPY today?
Japan’s financial markets reopened today after being closed for a bank holiday on Monday. Demand for the yen is robust and combined with a weaker dollar, overhead pressures for USD/JPY remain in place. This currency pair was sliding towards 140 as Asian markets came online – these are the support and resistance levels for today.
Support: 138.00
Resistance: 143.00
Central Bank Notes:
- The Policy Board of the Bank of Japan decided, by a 7-2 majority vote, to set the following guideline for money market operations for the intermeeting period and decided on the following measures:
- The Bank will encourage the uncollateralized overnight call rate to remain at around 0.25% while reducing its purchase amount of Japanese government bonds (JGB) by a unanimous vote.
- The Bank decided, by a unanimous vote, on a plan to reduce the amount of its monthly outright purchases of JGBs so that it will be about 3 trillion yen in January-March 2026; the amount will be cut down by about 400 billion yen each calendar quarter in principle.
- The year-on-year rate of increase in the CPI (all items less fresh food) is likely to be at around 2.5% for fiscal 2024 and then be at around 2% for fiscal 2025 and 2026.
- Meanwhile, underlying CPI inflation is expected to increase gradually, since it is projected that the output gap will improve and that medium- to long-term inflation expectations will rise with a virtuous cycle between wages and prices continuing to intensify.
- In the second half of the projection period, it is likely to be at a level that is generally consistent with the price stability target of 2%.
- Japan’s economy is likely to keep growing at a pace above its potential growth rate, with overseas economies continuing to grow moderately and as a virtuous cycle from income to spending gradually intensifies against the background of factors such as accommodative financial conditions.
- Next meeting is on 20 September 2024.
Next 24 Hours Bias
Weak Bearish
The Euro (EUR)
Key news events today
ZEW Economic Sentiment (9:00 am GMT)
What can we expect from EUR today?
The ZEW Economic Sentiment in the Euro Area plunged from 43.7 in July down to 17.9 in August as it deteriorated for the second month in a row while marking a nine-month low. Sentiment has been plummeting due to uncertainty surrounding the economic outlook and the direction of monetary policies in this economic region. September’s forecast of 16.4 points to a third consecutive month of deterioration and a larger-than-anticipated drop could function as a potential bearish catalyst for the Euro during the European trading hours.
Central Bank Notes:
- The Governing Council today decided to reduce the three key ECB interest rates on 12th September, after holding rates steady in July.
- Accordingly, the interest rate on the main refinancing operations and the interest rates on the marginal lending facility and the deposit facility will be decreased to 3.65%, 3.90% and 3.50% respectively.
- Recent inflation data have come in broadly as expected, and the latest ECB staff projections see headline inflation averaging 2.5% in 2024, 2.2% in 2025 and 1.9% in 2026.
- For core inflation, the projections for 2024 and 2025 have been revised up slightly, as services inflation has been higher than expected. At the same time, staff continue to expect a rapid decline in core inflation, from 2.9% this year to 2.3% in 2025 and 2.0% in 2026.
- ECB staff projections forecast that the economy will grow by 0.8% in 2024, rising to 1.3% in 2025 and 1.5% in 2026 which is a slight downward revision compared with the June projections, mainly owing to a weaker contribution from domestic demand over the next few quarters.
- The Eurosystem no longer reinvests all of the principal payments from maturing securities purchased under the pandemic emergency purchase programme (PEPP), reducing the PEPP portfolio by €7.5 billion per month on average and the Governing Council intends to discontinue reinvestments under the PEPP at the end of 2024.
- The Council is determined to ensure that inflation returns to its 2% medium-term target in a timely manner and will keep policy rates sufficiently restrictive for as long as necessary to achieve this aim and is not pre-committing to a particular rate path.
- Next meeting is on 17 October 2024.
Next 24 Hours Bias
Weak Bullish
The Swiss Franc (CHF)
Key news events today
No major news events.
What can we expect from CHF today?
With demand for the dollar waning, USD/CHF fell under 0.8450 yesterday. This currency pair retraced slightly higher during the U.S. session before reversing to slide under 0.8450 once more as Asian markets came online – these are the support and resistance levels for today.
Support: 0.8400
Resistance: 0.8560
Central Bank Notes:
- The SNB eased monetary policy by lowering its key policy rate by 25 basis points for the second consecutive meeting, going from 1.50% to 1.25% in June.
- The underlying inflationary pressure has decreased again compared to the previous quarter but inflation had risen slightly since the last monetary policy assessment, and stood at 1.4% in May.
- The inflation forecast puts average annual inflation at 1.3% for 2024, 1.1% for 2025 and 1.0% for 2026, based on the assumption that the SNB policy rate is 1.25% over the entire forecast horizon.
- Swiss GDP growth was moderate in the first quarter of 2024 with the services sector continuing to expand, while manufacturing stagnated.
- Growth is likely to remain moderate in Switzerland in the coming quarters as the SNB anticipates GDP growth of around 1% this year while currently expecting growth of around 1.5% for 2025.
- Next meeting is on 26 September 2024.
Next 24 Hours Bias
Weak Bullish
The Pound (GBP)
Key news events today
No major news events.
What can we expect from GBP today?
Cable hit an overnight high of 1.3218 before pulling back towards 1.3200 at the beginning of the Asia session. This currency pair should remain elevated as the day progresses – these are the support and resistance levels for today.
Support: 1.3100
Resistance: 1.3260
Central Bank Notes:
- The Bank of England’s Monetary Policy Committee (MPC) voted by a majority of 5-to-4 to reduce its Official Bank Rate by 25 basis points to 5.00% on 1st August 2024.
- Five members preferred to reduce the Bank Rate by 25 basis points to 5%, an increase of two from the previous meeting while four members preferred to maintain the Bank Rate at 5.25%.
- Twelve-month CPI inflation was at the MPC’s 2% target in both May and June but it is expected to increase to around 2.75% in the second half of this year as declines in energy prices last year fall out of the annual comparison, revealing more clearly the prevailing persistence of domestic inflationary pressures. Private sector regular average weekly earnings growth has fallen to 5.6% in the three months to May, and services consumer price inflation has declined to 5.7% in June.
- GDP has picked up quite sharply so far this year, but underlying momentum appears weaker. GDP had grown by 0.7% in 2024 Q1, with that strength appearing to have continued into Q2. Growth in the first half of the year had been stronger than expected at the time of the May Report.
- Business surveys had continued to point to underlying growth of around 0.3% per quarter, somewhat weaker than headline GDP growth. A margin of slack should emerge in the economy as GDP falls below potential and the labour market eases further.
- The Committee noted that it is now appropriate to reduce slightly the degree of policy restrictiveness but monetary policy will need to continue to remain restrictive for sufficiently long until the risks to inflation returning sustainably to the 2% target in the medium term have dissipated further.
- The Committee continues to monitor closely the risks of inflation persistence and will decide the appropriate degree of monetary policy restrictiveness at each meeting.
- Next meeting is on 19 September 2024.
Next 24 Hours Bias
Weak Bullish
The Canadian Dollar (CAD)
Key news events today
CPI (12:30 pm GMT)
What can we expect from CAD today?
Inflation in Canada has moderated lower since the middle of last year as observed in the various inflation metrics such as median-, trimmed- and common-CPI. The forecasts for August point to further easing, albeit at a slower rate. Should inflationary pressures continue to dissipate further, the Loonie is likely to face headwinds and could potentially provide USD/CAD with a much-needed lift later today.
Central Bank Notes:
- The Bank of Canada reduced its target for the overnight rate by 25 basis points for the third consecutive meeting to 4.25% while continuing its policy of balance sheet normalization on 4th September.
- Canada’s economy grew 2.1% in the second quarter of 2024, led by government spending and business investment.
- This second quarter GDP growth was slightly stronger than forecast in July, but preliminary indicators suggest that economic activity was soft through June and July.
- As expected, inflation slowed further to 2.5% in July. The Bank’s preferred measures of core inflation averaged around 2.5% and the share of components of the consumer price index growing above 3% is roughly at its historical norm.
- High shelter price inflation is still the biggest contributor to total inflation but is starting to slow while inflation also remains elevated in some other services.
- The labour market continues to slow, with little change in employment in recent months. Wage growth, however, remains elevated relative to productivity.
- The Governing Council is carefully assessing these opposing forces on inflation and monetary policy decisions will be guided by incoming information and our assessment of their implications for the inflation outlook.
- The Bank remains resolute in its commitment to restoring price stability for Canadians.
- Next meeting is on 23 October 2024.
Next 24 Hours Bias
Weak Bullish
Oil
Key news events today
API Crude Oil Stock (8:30 pm GMT)
What can we expect from Oil today?
Despite high short interest by money managers such as hedge funds and other institutional investors as observed in data from the Intercontinental Exchange, crude prices remained supported. WTI oil rose above $70 to hit a high of $70.70 per barrel overnight to defy the current negative sentiment in oil markets. Moving over to U.S. inventories, the API stockpiles have declined over the past three weeks to signal slightly higher demand for crude oil and should we see another week of a stronger-than-anticipated drawdown, it could function as a much sought-after bullish catalyst for this commodity.
Next 24 Hours Bias
Weak Bullish
The post IC Markets Europe Fundamental Forecast | 17 September 2024 first appeared on IC Markets | Official Blog.
General Market Analysis – 17/09/24
405786 September 17, 2024 12:39 ICMarkets Market News
US Markets Mixed as Investors Eye Larger Rate Cut – Dow Up 0.55%
US markets saw a mixed performance just days before the crucial Federal Reserve rate decision, with markets increasingly pricing in the likelihood of a larger 0.5% rate cut. The Dow reached a record high, closing 0.55% higher at 41,622, while the S&P edged up 0.13%. In contrast, the tech-heavy Nasdaq slipped by 0.52%. US Treasury yields continued to fall, with the 2-year yield hitting its lowest point since September 2022 before settling 1.5 basis points lower at 3.561%. The 10-year yield also dropped by 3.1 basis points, closing at 3.618%. The US dollar took a further hit, with USD/JPY reaching its lowest level in a year, and the DXY closing down 0.33%.
Oil prices surged as markets continued to adjust to US production resuming following Hurricane Francine. Brent rose by 1.59% to $72.75, while WTI climbed 2.1% to $70.09. Gold reached a new record high, buoyed by the weaker dollar, peaking at $2,589.59 before settling 0.2% higher at $2,591.37.
Rate Cut Expectations Surge
Expectations for a Federal Reserve rate cut surged once again, with markets now pricing in a nearly 60% chance of a 50-basis point cut on Wednesday, up from around 28% at the start of trading on Friday. This significant shift in market sentiment comes despite the absence of new data or statements from Federal Reserve officials. This sudden move has sparked speculation, with some suggesting that information about the Fed’s decision may have been leaked. Traders now anticipate increased volatility surrounding this announcement, which is shaping up to be one of the most consequential in recent years.
Event Calendar Heats Up for Traders
The macroeconomic calendar picks up pace today, and traders are preparing for increased volatility as they await key rate decisions worldwide. While China remains on holiday during another quiet Asian session, European traders will be watching closely as the London session opens, with the release of Germany’s ZEW Economic Sentiment data, expected to print at 17.1. Tier 1 data releases kick off during the New York session, starting with Canada’s CPI figures, where the market is expecting a 0% change month-on-month for the headline figure. Simultaneously, US Retail Sales data is due, with forecasts predicting a 0.2% rise in core sales.
The post General Market Analysis – 17/09/24 first appeared on IC Markets | Official Blog.
Tuesday 17th September 2024: Technical Outlook and Review
405779 September 17, 2024 11:14 ICMarkets Market News
DXY (US Dollar Index):
Potential Direction: Bullish
Overall momentum of the chart: Bearish
Factors contributing to the momentum: The bearish overall momentum contrasts with the potential for a bullish bounce.
Price could potentially make a: Bullish bounce off pivot and head towards 1st resistance.
Pivot: 100.52
Supporting reasons: Swing high resistance, indicating a level where the price could reverse.
1st support: 100.24
Supporting reasons: 127.20% Fibonacci Extension, suggesting a key support level where price might find buying interest.
1st resistance: 101.26
Supporting reasons: Pullback resistance, 61.80% Fibonacci Retracement, indicating a strong level where price could face resistance if it moves upward.
EUR/USD:
Potential Direction: Bearish
Overall momentum of the chart: Bullish
Price could potentially make a bearish reaction off pivot and drop to 1st support.
Pivot: 1.1136
Supporting reasons: An overlap resistance, with 61.8% Fibonacci Retracement which may provide a significant level for a bearish reaction.
1st support: 1.1071
Supporting reasons: An overlap support with 50% Fibonacci Retracement, indicating a potential area where the price may find support if it drops.
1st resistance: 1.1183
Supporting reasons: Swing high resistance, which may be a key level if the price moves higher.
EUR/JPY:
Potential Direction: Bearish
Overall momentum of the chart: Bearish
Factors contributing to the momentum: The bearish overall momentum aligns with the potential for a bearish reaction.
Price could potentially make a: Bearish reaction off pivot and drop to 1st support.
Pivot: 157.54
Supporting reasons: An Overlap resistance, indicating a level where the price could face selling pressure.
1st support: 155.45
Supporting reasons: Swing low support, suggesting a significant level where the price might find buying interest if it drops.
1st resistance: 159.96
Supporting reasons: Pullback resistance, 61.80% Fibonacci Retracement, indicating a strong level where price could face resistance if it moves up.
EUR/GBP:
Potential Direction: Bearish
Overall momentum of the chart: Bearish
Factors contributing to the momentum: The bearish overall momentum aligns with the potential for a bearish reaction.
Price could potentially make a: Bearish reaction off pivot and drop to 1st support.
Pivot: 0.8430
Supporting reasons: Pullback resistance, indicating a potential resistance level where selling pressure might emerge.
1st support: 0.8400
Supporting reasons: Swing low support, a significant level where buying interest might be expected if the price falls.
1st resistance: 0.8454
Supporting reasons: An Overlap resistance and 23.60% Fibonacci Retracement, suggesting that this level could act as resistance if the price moves upward.
GBP/USD:
Potential Direction: Bearish
Overall momentum of the chart: Bearish
Factors contributing to the momentum: The bearish overall momentum aligns with the potential for a bearish reaction.
Price could potentially make a: Bearish reaction off pivot and drop to 1st support.
Pivot: 1.3182
Supporting reasons: An Overlap resistance and 61.80% Fibonacci Projection, indicating this level might act as resistance where the price could potentially reverse.
1st support: 1.3104
Supporting reasons: An Overlap support and 50% Fibonacci Retracement, suggesting this level could provide support if the price drops.
1st resistance: 1.3303
Supporting reasons: 127.20% Fibonacci Extension, indicating potential resistance if the price moves upward.
GBP/JPY:
Potential Direction: Bearish
Overall momentum of the chart: Bearish
Factors contributing to the momentum: The overall bearish momentum suggests a continuation in the same direction.
Price could potentially make a: Bearish continuation towards 1st support.
Pivot: 186.65
Supporting reasons: An Overlap resistance, indicating this level might act as a barrier for price movement.
1st support: 183.74
Supporting reasons: Swing low support, suggesting this level could hold as support if the price declines.
1st resistance: 189.28
Supporting reasons: An Overlap resistance and 61.80% Fibonacci Retracement, indicating this level might act as resistance if the price moves upward.
USD/CHF:
Potential Direction: Bullish
Overall momentum of the chart: Bullish
Factors contributing to the momentum: The bullish momentum suggests the price may continue in an upward direction.
Price could potentially make a: Bullish bounce off pivot and heads towards 1st resistance.
Pivot: 0.8405
Supporting reasons: Swing low support, indicating this level may act as a support if the price pulls back.
1st support: 0.8343
Supporting reasons: 161.80% Fibonacci Extension, suggesting strong support at this level.
1st resistance: 0.8497
Supporting reasons: An Overlap resistance, indicating potential resistance if the price rises.
USD/JPY:
Potential Direction: Bearish
Overall momentum of the chart: Bearish
Factors contributing to the momentum: The bearish momentum suggests a continuation of the downtrend.
Price could potentially make a: Bearish reaction off pivot and drop to 1st support.
Pivot: 141.77
Supporting reasons: Pullback resistance, with 61.80% Fibonacci Retracement indicating this level could act as resistance if the price retraces.
1st support: 139.62
Supporting reasons: Swing low support, suggesting this level might hold as support if the price moves downward.
1st resistance: 143.70
Supporting reasons: An Overlap resistance, with 50% Fibonacci Retracement indicating potential resistance if the price rises.
USD/CAD:
Potential Direction: Bullish
Overall momentum of the chart: Neutral
Price is falling towards the pivot and could potentially make a bullish bounce off this level to rise towards the 1st resistance.
Pivot: 1.3549
Supporting reasons: Identified as an overlap support that aligns with a 38.2% Fibonacci retracement, suggesting a potential area where buying interests could pick up to stage a minor rebound.
1st support: 1.3492
Supporting reasons: Identified as a swing-low support that aligns close to a 61.8% Fibonacci retracement, indicating a key level where price has found strong support in the past.
1st resistance: 1.3615
Supporting reasons: Identified as an overlap resistance that aligns close to a 38.2% Fibonacci retracement, indicating a potential area that could halt any further upward movement.
AUD/USD:
Potential Direction: Bearish
Overall momentum of the chart: Neutral
Price could rise towards the pivot and potentially reverse off this level to drop towards the 1st support.
Pivot: 0.6813
Supporting reasons: Identified as a swing-high resistance, suggesting a potential level where selling interests could intensify.
1st support: 0.6685
Supporting reasons: Identified as an overlap support, indicating a key level where price has recently found support.
1st resistance: 0.6859
Supporting reasons: Identified as a swing-high resistance that aligns close to a 127.2% Fibonacci extension, indicating a potential area that could halt any further upward movement.
NZD/USD
Potential Direction: Bearish
Overall momentum of the chart: Neutral
Price could rise towards the pivot and potentially reverse off this level to drop towards the 1st support.
Pivot: 0.6236
Supporting reasons: Identified as an overlap resistance that aligns close to a 61.8% Fibonacci retracement, suggesting a potential level where selling interests could intensify.
1st support: 0.6155
Supporting reasons: Identified as an overlap support, indicating a potential level where price has found strong support in the past.
1st resistance: 0.6292
Supporting reasons: Identified as a swing-high resistance, indicating a potential area that could halt any further upward movement.
US30 (DJIA):
Potential Direction: Bullish
Overall momentum of the chart: Neutral
Price is falling towards the pivot and could potentially make a bullish bounce off this level to rise towards the 1st resistance.
Pivot: 41,056.42
Supporting reasons: Identified as a pullback support that aligns with a 38.2% Fibonacci retracement, suggesting a potential area where buying interests could pick up to resume the uptrend.
1st support: 40,704.12
Supporting reasons: Identified as a pullback support that aligns with a 61.8% Fibonacci retracement, indicating a key level where price has found support recently.
1st resistance: 41,992.28
Supporting reasons: Identified as a resistance that aligns with a 61.8% Fibonacci projection, indicating a potential area that could halt any further upward movement.
DE40 (DAX):
Potential Direction: Bullish
Overall momentum of the chart: Neutral
Price is falling towards the pivot and could potentially make a bullish bounce off this level to rise towards the 1st resistance.
Pivot: 18,424.10
Supporting reasons: Identified as a pullback support that aligns with a 61.8% Fibonacci retracement, suggesting a potential area where buying interests could pick up to resume the uptrend.
1st support: 18,247.90
Supporting reasons: Identified as a multi-swing-low support that aligns with a 38.2% Fibonacci retracement, indicating a key level where price has found support recently.
1st resistance: 18,971.60
Supporting reasons: Identified as a swing-high resistance that aligns close to the all-time high, indicating a potential area that could halt any further upward movement.
US500 (S&P 500):
Potential Direction: Bullish
Overall momentum of the chart: Neutral
Price is falling towards the pivot and could potentially make a bullish bounce off this level to rise towards the 1st resistance.
Pivot: 5,544.60
Supporting reasons: Identified as an overlap support that aligns with a 38.2% Fibonacci retracement, suggesting a potential area where buying interests could pick up to resume the uptrend.
1st support: 5,385.30
Supporting reasons: Identified as a swing-low support that aligns close to a 50% Fibonacci retracement, indicating a key level where price has found support recently.
1st resistance: 5,669.89
Supporting reasons: Identified as a swing-high resistance that aligns close to the all-time high, indicating a potential area that could halt any further upward movement.
BTC/USD (Bitcoin):
Potential Direction: Bullish
Overall momentum of the chart: Neutral
Price is falling towards the pivot and could potentially make a bullish bounce off this level to rise towards the 1st resistance.
Pivot: 56,576.60
Supporting reasons: Identified as an overlap support that aligns with a 50% Fibonacci retracement, suggesting a potential level where buying interests could pick up to stage a rebound.
1st support: 53,477.38
Supporting reasons: Identified as a swing-low support, indicating a key level where price has found strong in the past.
1st resistance: 60,783.25
Supporting reasons: Identified as a multi-swing-high resistance, indicating a potential area that could halt any further upward movement.
ETH/USD (Ethereum):
Potential Direction: Bullish
Overall momentum of the chart: Neutral
Price is falling towards the pivot and could potentially make a bullish bounce off this level to rise towards the 1st resistance.
Pivot: 2,218.93
Supporting reasons: Identified as a swing-low support that aligns with a 78.6% Fibonacci retracement, suggesting a potential level where buying interests could pick up to stage a rebound.
1st support: 2,044.47
Supporting reasons: Identified as a swing-low support, indicating a potential level where price has found support in the past.
1st resistance: 2,454.11
Supporting reasons: Identified as a multi-swing-high resistance that aligns close to a 50% Fibonacci retracement, indicating a potential area that could halt any further upward movement.
WTI/USD (Oil):
Potential Direction: Bearish
Overall momentum of the chart: Neutral
Price is rising towards the pivot and could potentially make a bearish reversal off this level to fall towards the 1st support.
Pivot: 72.61
Supporting reasons: Identified as a pullback resistance that aligns close to a 50% Fibonacci retracement, suggesting a potential level where selling pressures could intensify.
1st support: 68.91
Supporting reasons: Identified as an overlap support, indicating a key level where price has recently found support.
1st resistance: 75.38
Supporting reasons: Identified as an overlap resistance that aligns close to a 78.6% Fibonacci retracement, indicating a potential area that could halt any further upward movement.
XAU/USD (GOLD):
Potential Direction: Bearish
Overall momentum of the chart: Bullish
Price could potentially make a: Bearish reaction off pivot and drop to 1st support.
Pivot: 2583.95
Supporting reasons: 61.80% Fibonacci Projection, indicating this level might act as resistance if the price retraces.
1st support: 2531.45
Supporting reasons: Pullback support, suggesting this level could hold as support if the price drops.
1st resistance: 2613.19
Supporting reasons: 78.60% Fibonacci Projection, indicating potential resistance if the price rises further.
The accuracy, completeness and timeliness of the information contained on this site cannot be guaranteed. IC Markets does not warranty, guarantee or make any representations, or assume any liability regarding financial results based on the use of the information in the site.
News, views, opinions, recommendations and other information obtained from sources outside of www.icmarkets.com.au, used in this site are believed to be reliable, but we cannot guarantee their accuracy or completeness. All such information is subject to change at any time without notice. IC Markets assumes no responsibility for the content of any linked site.
The fact that such links may exist does not indicate approval or endorsement of any material contained on any linked site. IC Markets is not liable for any harm caused by the transmission, through accessing the services or information on this site, of a computer virus, or other computer code or programming device that might be used to access, delete, damage, disable, disrupt or otherwise impede in any manner, the operation of the site or of any user’s software, hardware, data or property.
The post Tuesday 17th September 2024: Technical Outlook and Review first appeared on IC Markets | Official Blog.